Cisco 2012 Annual Report Download - page 70
Download and view the complete annual report
Please find page 70 of the 2012 Cisco annual report below. You can navigate through the pages in the report by either clicking on the pages listed below, or by using the keyword search tool below to find specific information within the annual report.-
 1
1 -
2
-
3
-
4
-
5
-
6
-
7
-
8
-
9
-
10
-
11
-
12
-
13
-
14
-
15
-
16
-
17
-
18
-
19
-
20
-
21
-
22
-
23
-
24
-
25
-
26
-
27
-
28
-
29
-
30
-
31
-
32
-
33
-
34
-
35
-
36
-
37
-
38
-
39
-
40
-
41
-
42
-
43
-
44
-
45
-
46
-
47
-
48
-
49
-
50
-
51
-
52
-
53
-
54
-
55
-
56
-
57
-
58
-
59
-
 60
60 -
 61
61 -
 62
62 -
 63
63 -
 64
64 -
 65
65 -
 66
66 -
 67
67 -
 68
68 -
 69
69 -
 70
70 -
 71
71 -
 72
72 -
 73
73 -
 74
74 -
 75
75 -
 76
76 -
 77
77 -
 78
78 -
 79
79 -
 80
80 -
81
-
82
-
83
-
84
-
85
-
86
-
87
-
88
-
89
-
90
-
91
-
92
-
93
-
94
-
95
-
96
-
97
-
98
-
99
-
100
-
101
-
102
-
103
-
104
-
105
-
106
-
107
-
108
-
109
-
110
-
111
-
112
-
113
-
114
-
115
-
116
-
117
-
118
-
119
-
120
-
121
-
122
-
123
-
124
-
125
-
126
-
127
-
128
-
129
-
130
-
131
-
132
-
133
-
134
-
135
-
136
-
137
-
138
-
139
-
140
-
141
-
142
-
143
-
144
-
145
-
146
-
147
-
148
-
149
-
150
-
151
-
152
 |
 |

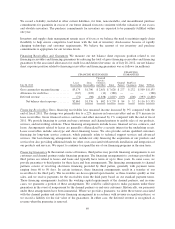
Fiscal 2011 Compared with Fiscal 2010
The increase in R&D expenses for fiscal 2011, as compared with fiscal 2010, was primarily due to higher
headcount-related expenses, higher contracted services, and increased depreciation and equipment expenditures.
The increase in depreciation expense was partially acquisition related.
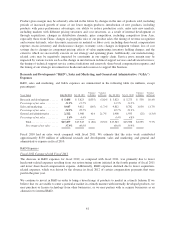
Sales and Marketing Expenses
Fiscal 2012 Compared with Fiscal 2011
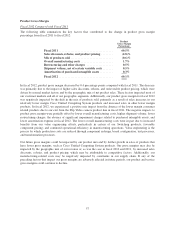
For fiscal 2012, as compared with fiscal 2011, sales and marketing expenses decreased by $165 million.
Marketing expenses decreased by $204 million, which were partially offset by an increase of $39 million in sales
expenses. The decrease in marketing expenses for the period was due to lower advertisement expenses, lower
headcount-related expenses, and lower share-based compensation expense. The increase in sales expenses was
due primarily to higher project related services, partially offset by lower headcount-related expenses and lower
share-based compensation expense. The decline in headcount related expenses for both sales and marketing was
in part attributable to our restructuring actions initiated in the fourth quarter of fiscal 2011.
Fiscal 2011 Compared with Fiscal 2010
Sales and marketing expenses for fiscal 2011 increased compared with fiscal 2010 due to an increase of $851
million in sales expenses and an increase of $179 million in marketing expenses. Both the sales expense and the
marketing expense components of the category increased for fiscal 2011 due to higher headcount-related
expenses, as well as higher outside services costs, higher depreciation expense, and increased share-based
compensation expense. Additionally, marketing expenses for fiscal 2011 increased due to higher advertisement
expenses.
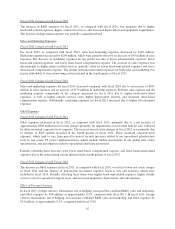
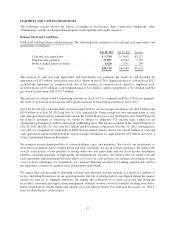
G&A Expenses
Fiscal 2012 Compared with Fiscal 2011
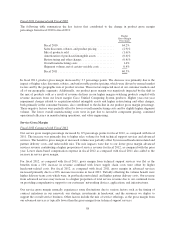
G&A expenses increased in fiscal 2012, as compared with fiscal 2011, primarily due to a net increase of
approximately $300 million in real estate charges primarily for impairments on real estate held for sale, followed
by other increased corporate-level expenses. The increase in real estate charges in fiscal 2012 was primarily due
to charges of $202 million recorded in the fourth quarter of fiscal 2012. These increased corporate-level
expenses, which tend to vary from period to period, include increases related to our operational infrastructure
such as real estate; IT project implementations, which include further investments in our global data center
infrastructure, and investments related to operational and financial systems.
Partially offsetting these increases were lower share-based compensation expense, and lower headcount-related
expenses due to the restructuring actions initiated in the fourth quarter of fiscal 2011.
Fiscal 2011 Compared with Fiscal 2010
The decrease in G&A expenses in fiscal 2011, as compared with fiscal 2010, was due to lower real estate charges
in fiscal 2011 and the absence of non-income tax-related expenses (such as fees and licenses), which were
included in fiscal 2010. Partially offsetting these items were higher headcount-related expenses, higher outside
services costs for operational support areas, and increased equipment, depreciation, and rent expenses.
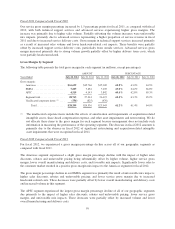
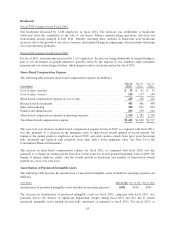
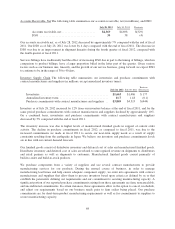
Effect of Foreign Currency
In fiscal 2012, foreign currency fluctuations, net of hedging, increased the combined R&D, sales and marketing,
and G&A expenses by $90 million, or approximately 0.5%, compared with fiscal 2011. In fiscal 2011, foreign
currency fluctuations, net of hedging, increased the combined R&D, sales and marketing, and G&A expenses by
$53 million, or approximately 0.3%, compared with fiscal 2010.
62