Cisco 2012 Annual Report Download - page 74
Download and view the complete annual report
Please find page 74 of the 2012 Cisco annual report below. You can navigate through the pages in the report by either clicking on the pages listed below, or by using the keyword search tool below to find specific information within the annual report.-
 1
1 -
2
-
3
-
4
-
5
-
6
-
7
-
8
-
9
-
10
-
11
-
12
-
13
-
14
-
15
-
16
-
17
-
18
-
19
-
20
-
21
-
22
-
23
-
24
-
25
-
26
-
27
-
28
-
29
-
30
-
31
-
32
-
33
-
34
-
35
-
36
-
37
-
38
-
39
-
40
-
41
-
42
-
43
-
44
-
45
-
46
-
47
-
48
-
49
-
50
-
51
-
52
-
53
-
54
-
55
-
56
-
57
-
58
-
59
-
60
-
61
-
62
-
63
-
 64
64 -
 65
65 -
 66
66 -
 67
67 -
 68
68 -
 69
69 -
 70
70 -
 71
71 -
 72
72 -
 73
73 -
 74
74 -
 75
75 -
 76
76 -
 77
77 -
 78
78 -
 79
79 -
 80
80 -
 81
81 -
 82
82 -
 83
83 -
 84
84 -
85
-
86
-
87
-
88
-
89
-
90
-
91
-
92
-
93
-
94
-
95
-
96
-
97
-
98
-
99
-
100
-
101
-
102
-
103
-
104
-
105
-
106
-
107
-
108
-
109
-
110
-
111
-
112
-
113
-
114
-
115
-
116
-
117
-
118
-
119
-
120
-
121
-
122
-
123
-
124
-
125
-
126
-
127
-
128
-
129
-
130
-
131
-
132
-
133
-
134
-
135
-
136
-
137
-
138
-
139
-
140
-
141
-
142
-
143
-
144
-
145
-
146
-
147
-
148
-
149
-
150
-
151
-
152
 |
 |

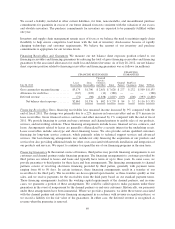
Fiscal 2011 Compared with Fiscal 2010
The increase in total net gains on available-for-sale investments in fiscal 2011 compared with fiscal 2010 was
primarily attributable to higher gains on publicly traded equity securities, partially offset by lower gains on fixed
income securities in fiscal 2011. These changes were the result of market conditions and the timing of sales of
these securities. For fiscal 2011 as compared with fiscal 2010, the decline in net gains on investments in privately
held companies was due to lower net equity method gains and lower gains on sales. The decline was partially
offset by lower impairment charges on investments in privately held companies. Impairment charges on
investments in privately held companies were $10 million and $25 million for fiscal 2011 and 2010, respectively.
The change in other gains and (losses), net for fiscal 2011 as compared with fiscal 2010, was primarily due to
fiscal 2011 experiencing lower gains from customer lease terminations, higher donations expense, and
unfavorable foreign exchange impacts.
Provision for Income Taxes
Our provision for income taxes is subject to volatility and could be adversely impacted by earnings being lower
than anticipated in countries that have lower tax rates and higher than anticipated in countries that have higher
tax rates. Our provision for income taxes does not include provisions for U.S. income taxes and foreign
withholding taxes associated with the repatriation of undistributed earnings of certain foreign subsidiaries that we
intend to reinvest indefinitely in our foreign subsidiaries. If these earnings were distributed to the United States in
the form of dividends or otherwise, or if the shares of the relevant foreign subsidiaries were sold or otherwise
transferred, we would be subject to additional U.S. income taxes (subject to an adjustment for foreign tax credits)
and foreign withholding taxes. Further, as a result of certain of our ongoing employment and capital investment
actions and commitments, our income in certain countries is subject to reduced tax rates and in some cases is
wholly exempt from tax. Our failure to meet these commitments could adversely impact our provision for
income taxes.
Fiscal 2012 Compared with Fiscal 2011
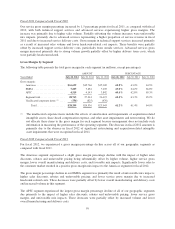
The provision for income taxes resulted in an effective tax rate of 20.8% for fiscal 2012, compared with 17.1%
for fiscal 2011. The net 3.7 percentage point increase in the effective tax rate between fiscal years was
attributable to a smaller proportion of net income which was subject to foreign income tax rates that are lower
than the U.S. federal statutory rate of 35% and the expiration of the U.S. federal R&D tax credit on December 31,
2011, partially offset by other items including a reduction in state taxes.
For a full reconciliation of our effective tax rate to the U.S. federal statutory rate of 35% and for further
explanation of our provision for income taxes, see Note 15 to the Consolidated Financial Statements.
Fiscal 2011 Compared with Fiscal 2010
The provision for income taxes resulted in an effective tax rate of 17.1% for fiscal 2011, compared with 17.5%
for fiscal 2010. During fiscal 2010, the U.S. Court of Appeals for the Ninth Circuit (the “Ninth Circuit”)
withdrew its prior holding and reaffirmed the 2005 U.S. Tax Court ruling in Xilinx, Inc. v. Commissioner. The
net 0.4 percentage point decrease in the effective tax rate between fiscal years was attributable to the absence in
fiscal 2011 of this tax benefit of $158 million, or 1.7 percentage points, offset by other items including the tax
benefit of $188 million, or 2.5 percentage points, related to the retroactive reinstatement of the U.S. federal R&D
credit.
66