Cisco 2012 Annual Report Download - page 62
Download and view the complete annual report
Please find page 62 of the 2012 Cisco annual report below. You can navigate through the pages in the report by either clicking on the pages listed below, or by using the keyword search tool below to find specific information within the annual report.-
 1
1 -
2
-
3
-
4
-
5
-
6
-
7
-
8
-
9
-
10
-
11
-
12
-
13
-
14
-
15
-
16
-
17
-
18
-
19
-
20
-
21
-
22
-
23
-
24
-
25
-
26
-
27
-
28
-
29
-
30
-
31
-
32
-
33
-
34
-
35
-
36
-
37
-
38
-
39
-
40
-
41
-
42
-
43
-
44
-
45
-
46
-
47
-
48
-
49
-
50
-
51
-
 52
52 -
 53
53 -
 54
54 -
 55
55 -
 56
56 -
 57
57 -
 58
58 -
 59
59 -
 60
60 -
 61
61 -
 62
62 -
 63
63 -
 64
64 -
 65
65 -
 66
66 -
 67
67 -
 68
68 -
 69
69 -
 70
70 -
 71
71 -
 72
72 -
73
-
74
-
75
-
76
-
77
-
78
-
79
-
80
-
81
-
82
-
83
-
84
-
85
-
86
-
87
-
88
-
89
-
90
-
91
-
92
-
93
-
94
-
95
-
96
-
97
-
98
-
99
-
100
-
101
-
102
-
103
-
104
-
105
-
106
-
107
-
108
-
109
-
110
-
111
-
112
-
113
-
114
-
115
-
116
-
117
-
118
-
119
-
120
-
121
-
122
-
123
-
124
-
125
-
126
-
127
-
128
-
129
-
130
-
131
-
132
-
133
-
134
-
135
-
136
-
137
-
138
-
139
-
140
-
141
-
142
-
143
-
144
-
145
-
146
-
147
-
148
-
149
-
150
-
151
-
152
 |
 |

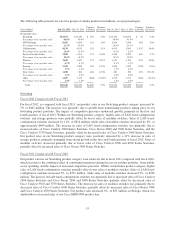
NGN Routing
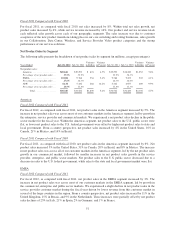
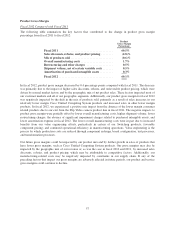
Fiscal 2012 Compared with Fiscal 2011
For fiscal 2012, as compared with fiscal 2011, net product sales in our NGN Routing product category increased
by 2%, or $161 million. The increase in sales of our NGN Routing product category was driven by a 6%, or $293
million, increase in sales of high-end router products, partially offset by a 3%, or $83 million, decline in sales of
our midrange and low-end router products. Within the high-end router products category, the increase was driven
by higher sales of Cisco CRS-3 Carrier Routing System products and higher sales of the Cisco Aggregation
Services Routers (“ASR”) 9000, 5000, and 1000 family of products. These increases were partially offset by
lower sales of Cisco 7600 and 12000 Series Routers. Within the midrange and low-end router products category,
the decrease was related to the product transition taking place within our Cisco Integrated Services Router (ISR)
products, as the sales decline in our older generation products had a greater impact than the growth experienced
with our Cisco ISR 1900, ISR 2900 and ISR 3900 router products in this category. Sales of other NGN Routing
products decreased by 6%, compared with fiscal 2011, primarily due to decreased sales of other routing and
optical networking products.
Fiscal 2011 Compared with Fiscal 2010
For fiscal 2011 as compared with fiscal 2010, growth in sales of our NGN Routing product category was driven
by a 7%, or $294 million, increase in sales of our high-end routers. Within high-end router products, the increase
was driven by higher sales of Cisco ASR 5000 products from our December 2009 acquisition of Starent and
higher sales of the Cisco ASR 1000 and 9000 products. These increases were partially offset by lower sales of
Cisco 12000 and 7600 Series Routers. For fiscal 2011, midrange and low-end routers sales decreased sales by
3%, or $84 million compared with fiscal 2010. Sales of other NGN Routing products increased by 31%,
compared with fiscal 2011, primarily due to increased sales of optical networking products.
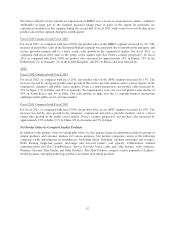
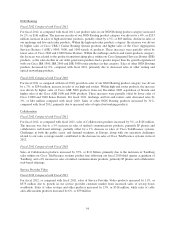
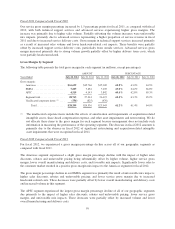
Collaboration
Fiscal 2012 Compared with Fiscal 2011
For fiscal 2012, as compared with fiscal 2011, sales of Collaboration products increased by 3%, or $126 million.
The increase was due to a 5% increase in sales of unified communications products, primarily IP phones and
collaborative web-based offerings, partially offset by a 1% decrease in sales of Cisco TelePresence systems.
Challenges in both the public sector and demand weakness in Europe, along with our execution challenges
related to our sales coverage model, contributed to the decrease in sales of Cisco TelePresence systems in fiscal
2012.
Fiscal 2011 Compared with Fiscal 2010
Sales of Collaboration products increased by 35%, or $1.0 billion, primarily due to the inclusion of Tandberg
sales within our Cisco TelePresence systems product line following our fiscal 2010 third quarter acquisition of
Tandberg, and a 6% increase in sales of unified communications products, primarily IP phones and collaborative
web-based offerings.
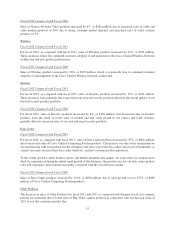
Service Provider Video
Fiscal 2012 Compared with Fiscal 2011
For fiscal 2012, as compared with fiscal 2011, sales of Service Provider Video products increased by 11%, or
$375 million due to growth in our service provider customer market from increased sales of set-top boxes
worldwide. Sales of video systems and other products increased by 13%, or $316 million, while sales of cable
and cable modem products increased by 6%, or $59 million.
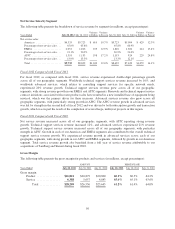
54