Cisco 2012 Annual Report Download - page 103
Download and view the complete annual report
Please find page 103 of the 2012 Cisco annual report below. You can navigate through the pages in the report by either clicking on the pages listed below, or by using the keyword search tool below to find specific information within the annual report.-
 1
1 -
2
-
3
-
4
-
5
-
6
-
7
-
8
-
9
-
10
-
11
-
12
-
13
-
14
-
15
-
16
-
17
-
18
-
19
-
20
-
21
-
22
-
23
-
24
-
25
-
26
-
27
-
28
-
29
-
30
-
31
-
32
-
33
-
34
-
35
-
36
-
37
-
38
-
39
-
40
-
41
-
42
-
43
-
44
-
45
-
46
-
47
-
48
-
49
-
50
-
51
-
52
-
53
-
54
-
55
-
56
-
57
-
58
-
59
-
60
-
61
-
62
-
63
-
64
-
65
-
66
-
67
-
68
-
69
-
70
-
71
-
72
-
73
-
74
-
75
-
76
-
77
-
78
-
79
-
80
-
81
-
82
-
83
-
84
-
85
-
86
-
87
-
88
-
89
-
90
-
91
-
92
-
 93
93 -
 94
94 -
 95
95 -
 96
96 -
 97
97 -
 98
98 -
 99
99 -
 100
100 -
 101
101 -
 102
102 -
 103
103 -
 104
104 -
 105
105 -
 106
106 -
 107
107 -
 108
108 -
 109
109 -
 110
110 -
 111
111 -
 112
112 -
 113
113 -
114
-
115
-
116
-
117
-
118
-
119
-
120
-
121
-
122
-
123
-
124
-
125
-
126
-
127
-
128
-
129
-
130
-
131
-
132
-
133
-
134
-
135
-
136
-
137
-
138
-
139
-
140
-
141
-
142
-
143
-
144
-
145
-
146
-
147
-
148
-
149
-
150
-
151
-
152
 |
 |

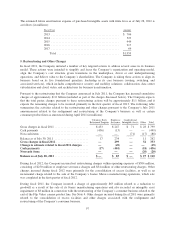
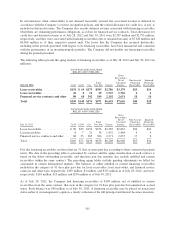
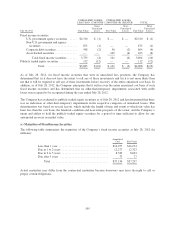
4. Goodwill and Purchased Intangible Assets
(a) Goodwill
Beginning in fiscal 2012, the Company’s reportable segments were changed to the following segments: the
Americas, EMEA, and APJC. As a result, the Company reallocated the goodwill at July 30, 2011 to these
reportable segments. The following table presents the goodwill allocated to the Company’s reportable segments
as of July 28, 2012 and July 30, 2011, as well as the changes to goodwill during fiscal 2012 and 2011 (in
millions):
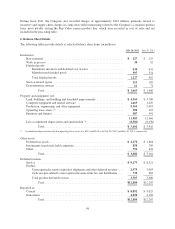
Balance at
July 30, 2011 Acquisitions Other
Balance at
July 28, 2012
Americas ................................. $11,627 $136 $ (8) $11,755
EMEA ................................... 3,272 64 (49) 3,287
APJC .................................... 1,919 37 — 1,956
Total ................................. $16,818 $237 $ (57) $16,998
Balance at
July 31, 2010 Acquisitions Other
Balance at
July 30, 2011
Americas .................................. $11,571 $122 $(66) $11,627
EMEA .................................... 3,209 38 25 3,272
APJC ..................................... 1,894 24 1 1,919
Total ................................. $16,674 $184 $(40) $16,818
In the preceding table, the column entitled “Other” primarily includes foreign currency translation and purchase
accounting adjustments. In fiscal 2011, “Other” also includes a goodwill reduction of $63 million related to the
sale of the Company’s manufacturing operations in Juarez, Mexico and an adjustment related to a divestiture.
The goodwill reductions were included in restructuring and other charges. See Note 5.
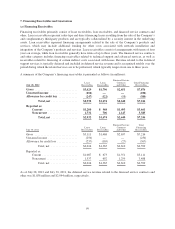
(b) Purchased Intangible Assets
The following tables present details of the Company’s intangible assets acquired through business combinations
completed during fiscal 2012 and 2011 (in millions, except years):
FINITE LIVES
INDEFINITE
LIVES
TOTALTECHNOLOGY
CUSTOMER
RELATIONSHIPS OTHER IPR&D
Fiscal 2012
Weighted-
Average Useful
Life (in Years) Amount
Weighted-
Average Useful
Life (in Years) Amount
Weighted-
Average Useful
Life (in Years) Amount Amount Amount
Lightwire, Inc. .. 5.0 $ 97 — $ — — $ — $ — $ 97
All others ...... 3.5 102 3.0 1 — — — 103
Total ...... $199 $ 1 $ — $ — $200
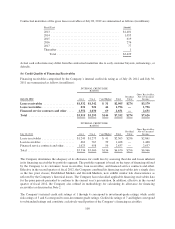
FINITE LIVES
INDEFINITE
LIVES
TOTALTECHNOLOGY
CUSTOMER
RELATIONSHIPS OTHER IPR&D
Fiscal 2011
Weighted-
Average Useful
Life (in Years) Amount
Weighted-
Average Useful
Life (in Years) Amount
Weighted-
Average Useful
Life (in Years) Amount Amount Amount
Total ...... 4.8 $92 6.4 $16 2.5 $1 $5 $114
95