Cisco 2012 Annual Report Download - page 61
Download and view the complete annual report
Please find page 61 of the 2012 Cisco annual report below. You can navigate through the pages in the report by either clicking on the pages listed below, or by using the keyword search tool below to find specific information within the annual report.-
 1
1 -
2
-
3
-
4
-
5
-
6
-
7
-
8
-
9
-
10
-
11
-
12
-
13
-
14
-
15
-
16
-
17
-
18
-
19
-
20
-
21
-
22
-
23
-
24
-
25
-
26
-
27
-
28
-
29
-
30
-
31
-
32
-
33
-
34
-
35
-
36
-
37
-
38
-
39
-
40
-
41
-
42
-
43
-
44
-
45
-
46
-
47
-
48
-
49
-
50
-
 51
51 -
 52
52 -
 53
53 -
 54
54 -
 55
55 -
 56
56 -
 57
57 -
 58
58 -
 59
59 -
 60
60 -
 61
61 -
 62
62 -
 63
63 -
 64
64 -
 65
65 -
 66
66 -
 67
67 -
 68
68 -
 69
69 -
 70
70 -
 71
71 -
72
-
73
-
74
-
75
-
76
-
77
-
78
-
79
-
80
-
81
-
82
-
83
-
84
-
85
-
86
-
87
-
88
-
89
-
90
-
91
-
92
-
93
-
94
-
95
-
96
-
97
-
98
-
99
-
100
-
101
-
102
-
103
-
104
-
105
-
106
-
107
-
108
-
109
-
110
-
111
-
112
-
113
-
114
-
115
-
116
-
117
-
118
-
119
-
120
-
121
-
122
-
123
-
124
-
125
-
126
-
127
-
128
-
129
-
130
-
131
-
132
-
133
-
134
-
135
-
136
-
137
-
138
-
139
-
140
-
141
-
142
-
143
-
144
-
145
-
146
-
147
-
148
-
149
-
150
-
151
-
152
 |
 |

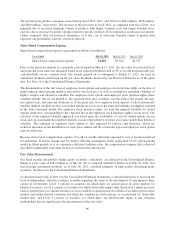
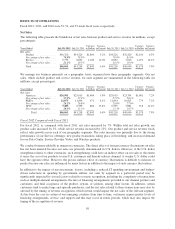
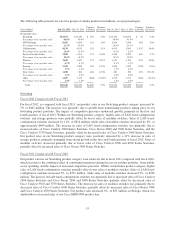
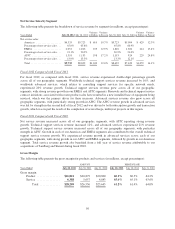
The following table presents net sales for groups of similar products (in millions, except percentages):
Years Ended July 28, 2012 July 30, 2011
Variance
in Dollars
Variance
in Percent July 30, 2011 July 31, 2010
Variance
in Dollars
Variance
in Percent
Net product sales:
Switching .................... $14,531 $14,130 $ 401 2.8% $14,130 $14,074 $ 56 0.4%
Percentage of net product sales ... 40.0% 40.9% 40.9% 43.4%
NGN Routing ................. 8,425 8,264 161 1.9% 8,264 7,868 396 5.0%
Percentage of net product sales ... 23.2% 24.0% 24.0% 24.3%
Collaboration ................. 4,139 4,013 126 3.1% 4,013 2,981 1,032 34.6%
Percentage of net product sales ... 11.4% 11.6% 11.6% 9.2%
Service Provider Video ......... 3,858 3,483 375 10.8% 3,483 3,294 189 5.7%
Percentage of net product sales ... 10.6% 10.1% 10.1% 10.2%
Wireless ..................... 1,699 1,427 272 19.1% 1,427 1,134 293 25.8%
Percentage of net product sales ... 4.7% 4.1% 4.1% 3.5%
Security ..................... 1,349 1,200 149 12.4% 1,200 1,302 (102) (7.8)%
Percentage of net product sales ... 3.7% 3.5% 3.5% 4.0%
Data Center .................. 1,298 694 604 87.0% 694 196 498 254.1%
Percentage of net product sales ... 3.6% 2.0% 2.0% 0.6%
Other ....................... 1,027 1,315 (288) (21.9)% 1,315 1,571 (256) (16.3)%
Percentage of net product sales ... 2.8% 3.8% 3.8% 4.8%
Total ...................... $36,326 $34,526 $1,800 5.2% $34,526 $32,420 $2,106 6.5%
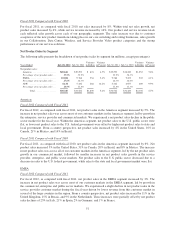
Switching
Fiscal 2012 Compared with Fiscal 2011
For fiscal 2012, as compared with fiscal 2011, net product sales in our Switching product category increased by
3% or $401 million. The increase was primarily due to growth from transitioning products taking place in our
Switching product portfolio. The impact of competitive pressures moderated growth, primarily in the first and
fourth quarters of fiscal 2012. Within our Switching product category, higher sales of LAN fixed-configuration
switches and storage products were partially offset by lower sales of modular switches. Sales of LAN fixed-
configuration switches increased by 11%, or $814 million, while sales of modular switches decreased by 8%, or
approximately $469 million. The increase in sales of LAN fixed-configuration switches was primarily due to
increased sales of Cisco Catalyst 2960 Series Switches, Cisco Nexus 2000 and 5000 Series Switches, and the
Cisco Catalyst 3750 Series Switches, partially offset by decreased sales of Cisco Catalyst 3560 Series Switches.
Net product sales in our Switching product category were positively impacted by a 11% increase in sales of
storage products, primarily stemming from strong growth in the first and fourth quarters of fiscal 2012. Sales of
modular switches decreased primarily due to lower sales of Cisco Catalyst 6500 and 4500 Series Switches,
partially offset by increased sales of Cisco Nexus 7000 Series Switches.
Fiscal 2011 Compared with Fiscal 2010
Net product sales in our Switching product category were relatively flat in fiscal 2011 compared with fiscal 2010,
which was due to the combined effect of continuing transitions taking place in our product portfolio, lower public
sector spending, and the impact of increased competitive pressures. Within our Switches product category, higher
sales of LAN fixed-configuration switches partially offset lower sales of modular switches. Sales of LAN fixed-
configuration switches increased 5%, or $331 million, while sales of modular switches decreased 5%, or $306
million. The increase in LAN fixed-configuration switches was primarily due to increased sales of Cisco Catalyst
2960 Series Switches and Cisco Nexus 2000 and 5000 Series Switches, partially offset by decreased sales of
Cisco Catalyst 3560 and 3750 Series Switches. The decrease in sales of modular switches was primarily due to
decreased sales of Cisco Catalyst 6500 Series Switches, partially offset by increased sales of Cisco Nexus 7000
and Cisco Catalyst 4500 Series Switches. Net product sales increased 6%, or $31 million, in Storage, which was
attributable to increased sales of our Cisco MDS 9000 product line.
53