Cisco 2012 Annual Report Download - page 69
Download and view the complete annual report
Please find page 69 of the 2012 Cisco annual report below. You can navigate through the pages in the report by either clicking on the pages listed below, or by using the keyword search tool below to find specific information within the annual report.-
 1
1 -
2
-
3
-
4
-
5
-
6
-
7
-
8
-
9
-
10
-
11
-
12
-
13
-
14
-
15
-
16
-
17
-
18
-
19
-
20
-
21
-
22
-
23
-
24
-
25
-
26
-
27
-
28
-
29
-
30
-
31
-
32
-
33
-
34
-
35
-
36
-
37
-
38
-
39
-
40
-
41
-
42
-
43
-
44
-
45
-
46
-
47
-
48
-
49
-
50
-
51
-
52
-
53
-
54
-
55
-
56
-
57
-
58
-
 59
59 -
 60
60 -
 61
61 -
 62
62 -
 63
63 -
 64
64 -
 65
65 -
 66
66 -
 67
67 -
 68
68 -
 69
69 -
 70
70 -
 71
71 -
 72
72 -
 73
73 -
 74
74 -
 75
75 -
 76
76 -
 77
77 -
 78
78 -
 79
79 -
80
-
81
-
82
-
83
-
84
-
85
-
86
-
87
-
88
-
89
-
90
-
91
-
92
-
93
-
94
-
95
-
96
-
97
-
98
-
99
-
100
-
101
-
102
-
103
-
104
-
105
-
106
-
107
-
108
-
109
-
110
-
111
-
112
-
113
-
114
-
115
-
116
-
117
-
118
-
119
-
120
-
121
-
122
-
123
-
124
-
125
-
126
-
127
-
128
-
129
-
130
-
131
-
132
-
133
-
134
-
135
-
136
-
137
-
138
-
139
-
140
-
141
-
142
-
143
-
144
-
145
-
146
-
147
-
148
-
149
-
150
-
151
-
152
 |
 |

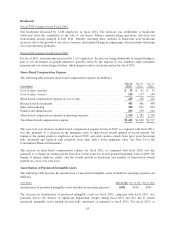
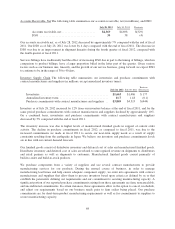
Product gross margin may be adversely affected in the future by changes in the mix of products sold, including
periods of increased growth of some of our lower margin products; introduction of new products, including
products with price-performance advantages; our ability to reduce production costs; entry into new markets,
including markets with different pricing structures and cost structures, as a result of internal development or
through acquisitions; changes in distribution channels; price competition, including competitors from Asia,
especially those from China; changes in geographic mix of our product sales; the timing of revenue recognition
and revenue deferrals; sales discounts; increases in material or labor costs, including share-based compensation
expense; excess inventory and obsolescence charges; warranty costs; changes in shipment volume; loss of cost
savings due to changes in component pricing; effects of value engineering; inventory holding charges; and the
extent to which we successfully execute on our strategy and operating plans. Additionally, our manufacturing-
related costs may be negatively impacted by constraints in our supply chain. Service gross margin may be
impacted by various factors such as the change in mix between technical support services and advanced services;
the timing of technical support service contract initiations and renewals; share-based compensation expense; and
the timing of our strategic investments in headcount and resources to support this business.
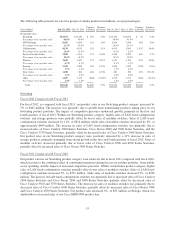
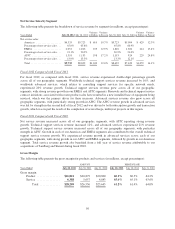
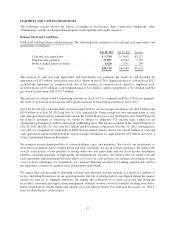
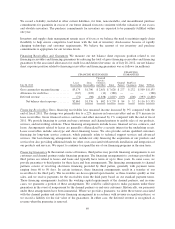
Research and Development (“R&D”), Sales and Marketing, and General and Administrative (“G&A”)
Expenses
R&D, sales and marketing, and G&A expenses are summarized in the following table (in millions, except
percentages):
Years Ended July 28, 2012 July 30, 2011
Variance
in Dollars
Variance
in Percent July 30, 2011 July 31, 2010
Variance
in Dollars
Variance
in Percent
Research and development ...... $ 5,488 $ 5,823 $(335) (5.8)% $ 5,823 $ 5,273 $ 550 10.4%
Percentage of net sales ......... 11.9% 13.5% 13.5% 13.2%
Sales and marketing ............ 9,647 9,812 (165) (1.7)% 9,812 8,782 1,030 11.7%
Percentage of net sales ......... 20.9% 22.7% 22.7% 21.9%
General and administrative ...... 2,322 1,908 414 21.7% 1,908 1,933 (25) (1.3)%
Percentage of net sales ......... 5.0% 4.4% 4.4% 4.8%
Total .................... $17,457 $17,543 $ (86) (0.5)% $17,543 $15,988 $1,555 9.7%
Percentage of net sales ..... 37.9% 40.6% 40.6% 39.9%
Fiscal 2010 had an extra week compared with fiscal 2011. We estimate that the extra week contributed
approximately $150 million of additional research and development, sales and marketing, and general and
administrative expense in fiscal 2010.
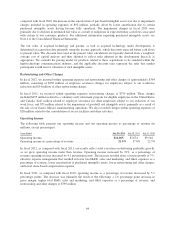
R&D Expenses
Fiscal 2012 Compared with Fiscal 2011
The decrease in R&D expenses for fiscal 2012, as compared with fiscal 2011, was primarily due to lower
headcount-related expenses resulting from our restructuring actions initiated in the fourth quarter of fiscal 2011
and lower share-based compensation expense. Additionally, R&D expenses declined due to lower acquisition-
related expenses, which was driven by the absence in fiscal 2012 of certain compensation payments that were
paid in the prior year.
We continue to invest in R&D in order to bring a broad range of products to market in a timely fashion. If we
believe that we are unable to enter a particular market in a timely manner with internally developed products, we
may purchase or license technology from other businesses, or we may partner with or acquire businesses as an
alternative to internal R&D.
61