Cisco 2012 Annual Report Download - page 58
Download and view the complete annual report
Please find page 58 of the 2012 Cisco annual report below. You can navigate through the pages in the report by either clicking on the pages listed below, or by using the keyword search tool below to find specific information within the annual report.-
 1
1 -
2
-
3
-
4
-
5
-
6
-
7
-
8
-
9
-
10
-
11
-
12
-
13
-
14
-
15
-
16
-
17
-
18
-
19
-
20
-
21
-
22
-
23
-
24
-
25
-
26
-
27
-
28
-
29
-
30
-
31
-
32
-
33
-
34
-
35
-
36
-
37
-
38
-
39
-
40
-
41
-
42
-
43
-
44
-
45
-
46
-
47
-
 48
48 -
 49
49 -
 50
50 -
 51
51 -
 52
52 -
 53
53 -
 54
54 -
 55
55 -
 56
56 -
 57
57 -
 58
58 -
 59
59 -
 60
60 -
 61
61 -
 62
62 -
 63
63 -
 64
64 -
 65
65 -
 66
66 -
 67
67 -
 68
68 -
69
-
70
-
71
-
72
-
73
-
74
-
75
-
76
-
77
-
78
-
79
-
80
-
81
-
82
-
83
-
84
-
85
-
86
-
87
-
88
-
89
-
90
-
91
-
92
-
93
-
94
-
95
-
96
-
97
-
98
-
99
-
100
-
101
-
102
-
103
-
104
-
105
-
106
-
107
-
108
-
109
-
110
-
111
-
112
-
113
-
114
-
115
-
116
-
117
-
118
-
119
-
120
-
121
-
122
-
123
-
124
-
125
-
126
-
127
-
128
-
129
-
130
-
131
-
132
-
133
-
134
-
135
-
136
-
137
-
138
-
139
-
140
-
141
-
142
-
143
-
144
-
145
-
146
-
147
-
148
-
149
-
150
-
151
-
152
 |
 |

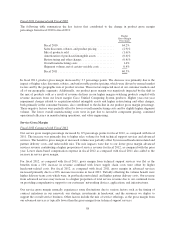
RESULTS OF OPERATIONS
Fiscal 2012, 2011, and 2010 were 52, 52, and 53-week fiscal years, respectively.
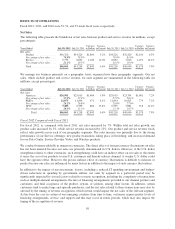
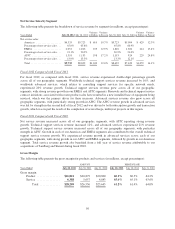
Net Sales
The following table presents the breakdown of net sales between product and service revenue (in millions, except
percentages):
Years Ended July 28, 2012 July 30, 2011
Variance
in Dollars
Variance
in Percent July 30, 2011 July 31, 2010
Variance
in Dollars
Variance
in Percent
Net sales:
Product ................ $36,326 $34,526 $1,800 5.2% $34,526 $32,420 $2,106 6.5%
Percentage of net sales .... 78.9% 79.9% 79.9% 81.0%
Service ................. 9,735 8,692 1,043 12.0% 8,692 7,620 1,072 14.1%
Percentage of net sales .... 21.1% 20.1% 20.1% 19.0%
Total .................. $46,061 $43,218 $2,843 6.6% $43,218 $40,040 $3,178 7.9%
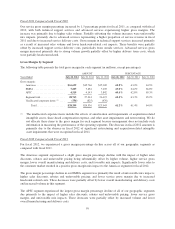
We manage our business primarily on a geographic basis, organized into three geographic segments. Our net
sales, which include product and service revenue, for each segment are summarized in the following table (in
millions, except percentages):
Years Ended July 28, 2012 July 30, 2011
Variance
in Dollars
Variance
in Percent July 30, 2011 July 31, 2010
Variance
in Dollars
Variance
in Percent
Net sales:
Americas ...............
$26,501 $25,015 $1,486 5.9% $25,015 $23,334 $1,681 7.2%
Percentage of net sales .... 57.5% 57.9% 57.9% 58.3%
EMEA .................
12,075 11,604 471 4.1% 11,604 10,825 779 7.2%
Percentage of net sales .... 26.2% 26.8% 26.8% 27.0%
APJC ..................
7,485 6,599 886 13.4% 6,599 5,881 718 12.2%
Percentage of net sales .... 16.3% 15.3% 15.3% 14.7%
Total .............. $46,061 $43,218 $2,843 6.6% $43,218 $40,040 $3,178 7.9%
Fiscal 2012 Compared with Fiscal 2011
For fiscal 2012, as compared with fiscal 2011, net sales increased by 7%. Within total net sales growth, net
product sales increased by 5%, while service revenue increased by 12%. Our product and service revenue totals
reflect sales growth across each of our geographic segments. The sales increase was primarily due to: the strong
performance of our Service offerings; new product transitions taking place in Switching; and increased demand
for our Data Center, Service Provider Video, and Wireless products.
We conduct business globally in numerous currencies. The direct effect of foreign currency fluctuations on sales
has not been material because our sales are primarily denominated in U.S. dollars. However, if the U.S. dollar
strengthens relative to other currencies, such strengthening could have an indirect effect on our sales to the extent
it raises the cost of our products to non-U.S. customers and thereby reduces demand. A weaker U.S. dollar could
have the opposite effect. However, the precise indirect effect of currency fluctuations is difficult to measure or
predict because our sales are influenced by many factors in addition to the impact of such currency fluctuations.
In addition to the impact of macroeconomic factors, including a reduced IT spending environment and budget-
driven reductions in spending by government entities, net sales by segment in a particular period may be
significantly impacted by several factors related to revenue recognition, including the complexity of transactions
such as multiple-element arrangements; the mix of financing arrangements provided to our channel partners and
customers; and final acceptance of the product, system, or solution, among other factors. In addition, certain
customers tend to make large and sporadic purchases, and the net sales related to these transactions may also be
affected by the timing of revenue recognition, which in turn would impact the net sales of the relevant segment.
As has been the case in certain of our emerging countries from time to time, customers require greater levels of
financing arrangements, service, and support and this may occur in future periods, which may also impact the
timing of the recognition of revenue.
50