Cisco 2012 Annual Report Download - page 108
Download and view the complete annual report
Please find page 108 of the 2012 Cisco annual report below. You can navigate through the pages in the report by either clicking on the pages listed below, or by using the keyword search tool below to find specific information within the annual report.-
 1
1 -
2
-
3
-
4
-
5
-
6
-
7
-
8
-
9
-
10
-
11
-
12
-
13
-
14
-
15
-
16
-
17
-
18
-
19
-
20
-
21
-
22
-
23
-
24
-
25
-
26
-
27
-
28
-
29
-
30
-
31
-
32
-
33
-
34
-
35
-
36
-
37
-
38
-
39
-
40
-
41
-
42
-
43
-
44
-
45
-
46
-
47
-
48
-
49
-
50
-
51
-
52
-
53
-
54
-
55
-
56
-
57
-
58
-
59
-
60
-
61
-
62
-
63
-
64
-
65
-
66
-
67
-
68
-
69
-
70
-
71
-
72
-
73
-
74
-
75
-
76
-
77
-
78
-
79
-
80
-
81
-
82
-
83
-
84
-
85
-
86
-
87
-
88
-
89
-
90
-
91
-
92
-
93
-
94
-
95
-
96
-
97
-
 98
98 -
 99
99 -
 100
100 -
 101
101 -
 102
102 -
 103
103 -
 104
104 -
 105
105 -
 106
106 -
 107
107 -
 108
108 -
 109
109 -
 110
110 -
 111
111 -
 112
112 -
 113
113 -
 114
114 -
 115
115 -
 116
116 -
 117
117 -
 118
118 -
119
-
120
-
121
-
122
-
123
-
124
-
125
-
126
-
127
-
128
-
129
-
130
-
131
-
132
-
133
-
134
-
135
-
136
-
137
-
138
-
139
-
140
-
141
-
142
-
143
-
144
-
145
-
146
-
147
-
148
-
149
-
150
-
151
-
152
 |
 |

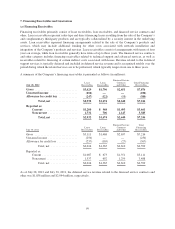
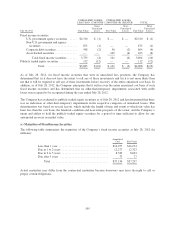
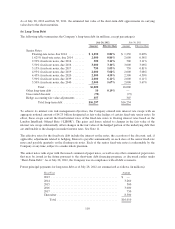
Contractual maturities of the gross lease receivables at July 28, 2012 are summarized as follows (in millions):
Fiscal Year Amount
2013 .............................................. $1,401
2014 .............................................. 1,055
2015 .............................................. 619
2016 .............................................. 276
2017 .............................................. 77
Thereafter .......................................... 1
Total .......................................... $3,429
Actual cash collections may differ from the contractual maturities due to early customer buyouts, refinancings, or
defaults.
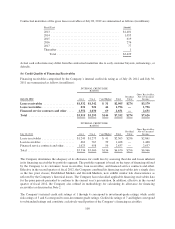
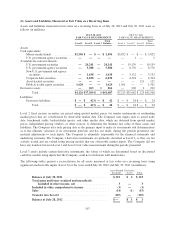
(b) Credit Quality of Financing Receivables
Financing receivables categorized by the Company’s internal credit risk rating as of July 28, 2012 and July 30,
2011 are summarized as follows (in millions):
INTERNAL CREDIT RISK
RATING
July 28, 2012 1to4 5to6 7 and Higher Total
Residual
Value
Gross Receivables,
Net of Unearned
Income
Lease receivables ..................... $1,532 $1,342 $ 31 $2,905 $274 $3,179
Loan receivables ...................... 831 921 44 1,796 — 1,796
Financed service contracts and other ..... 1,552 1,030 69 2,651 — 2,651
Total ............................... $3,915 $3,293 $144 $7,352 $274 $7,626
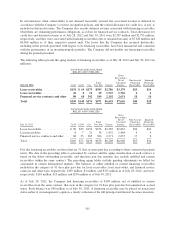
INTERNAL CREDIT RISK
RATING
July 30, 2011 1to4 5to6 7 and Higher Total
Residual
Value
Gross Receivables,
Net of Unearned
Income
Lease receivables ...................... $1,249 $1,275 $ 41 $2,565 $296 $2,861
Loan receivables ...................... 662 767 39 1,468 — 1,468
Financed service contracts and other ....... 1,623 958 56 2,637 — 2,637
Total ................................ $3,534 $3,000 $136 $6,670 $296 $6,966
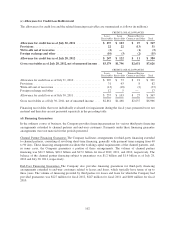
The Company determines the adequacy of its allowance for credit loss by assessing the risks and losses inherent
in its financing receivables by portfolio segment. The portfolio segment is based on the types of financing offered
by the Company to its customers: lease receivables, loan receivables, and financed service contracts and other.
Effective in the second quarter of fiscal 2012, the Company combined its financing receivables into a single class
as the two prior classes, Established Markets and Growth Markets, now exhibit similar risk characteristics as
reflected by the Company’s historical losses. The Company has reclassified applicable financing receivables data
for the prior periods presented to conform to the current year’s presentation. In addition, effective in the second
quarter of fiscal 2012, the Company also refined its methodology for calculating its allowance for financing
receivables as discussed in Note 2.
The Company’s internal credit risk ratings of 1 through 4 correspond to investment-grade ratings, while credit
risk ratings of 5 and 6 correspond to non-investment grade ratings. Credit risk ratings of 7 and higher correspond
to substandard ratings and constitute a relatively small portion of the Company’s financing receivables.
100