Cisco 2012 Annual Report Download - page 118
Download and view the complete annual report
Please find page 118 of the 2012 Cisco annual report below. You can navigate through the pages in the report by either clicking on the pages listed below, or by using the keyword search tool below to find specific information within the annual report.-
 1
1 -
2
-
3
-
4
-
5
-
6
-
7
-
8
-
9
-
10
-
11
-
12
-
13
-
14
-
15
-
16
-
17
-
18
-
19
-
20
-
21
-
22
-
23
-
24
-
25
-
26
-
27
-
28
-
29
-
30
-
31
-
32
-
33
-
34
-
35
-
36
-
37
-
38
-
39
-
40
-
41
-
42
-
43
-
44
-
45
-
46
-
47
-
48
-
49
-
50
-
51
-
52
-
53
-
54
-
55
-
56
-
57
-
58
-
59
-
60
-
61
-
62
-
63
-
64
-
65
-
66
-
67
-
68
-
69
-
70
-
71
-
72
-
73
-
74
-
75
-
76
-
77
-
78
-
79
-
80
-
81
-
82
-
83
-
84
-
85
-
86
-
87
-
88
-
89
-
90
-
91
-
92
-
93
-
94
-
95
-
96
-
97
-
98
-
99
-
100
-
101
-
102
-
103
-
104
-
105
-
106
-
107
-
 108
108 -
 109
109 -
 110
110 -
 111
111 -
 112
112 -
 113
113 -
 114
114 -
 115
115 -
 116
116 -
 117
117 -
 118
118 -
 119
119 -
 120
120 -
 121
121 -
 122
122 -
 123
123 -
 124
124 -
 125
125 -
 126
126 -
 127
127 -
 128
128 -
129
-
130
-
131
-
132
-
133
-
134
-
135
-
136
-
137
-
138
-
139
-
140
-
141
-
142
-
143
-
144
-
145
-
146
-
147
-
148
-
149
-
150
-
151
-
152
 |
 |

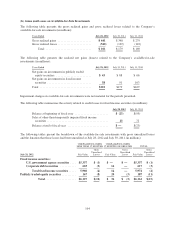
As of July 28, 2012 and July 30, 2011, the estimated fair value of the short-term debt approximates its carrying
value due to the short maturities.
(b) Long-Term Debt
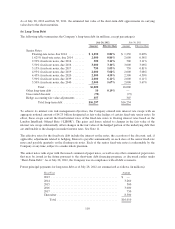
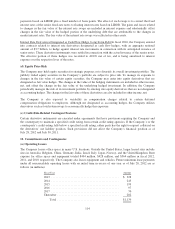
The following table summarizes the Company’s long-term debt (in millions, except percentages):
July 28, 2012 July 30, 2011
Amount Effective Rate Amount Effective Rate
Senior Notes:
Floating-rate notes, due 2014 ........... $ 1,250 0.81% $ 1,250 0.60%
1.625% fixed-rate notes, due 2014 ....... 2,000 0.84% 2,000 0.58%
2.90% fixed-rate notes, due 2014 ........ 500 3.11% 500 3.11%
5.50% fixed-rate notes, due 2016 ........ 3,000 3.16% 3,000 3.06%
3.15% fixed-rate notes, due 2017 ........ 750 1.03% 750 0.81%
4.95% fixed-rate notes, due 2019 ........ 2,000 5.08% 2,000 5.08%
4.45% fixed-rate notes, due 2020 ........ 2,500 4.50% 2,500 4.50%
5.90% fixed-rate notes, due 2039 ........ 2,000 6.11% 2,000 6.11%
5.50% fixed-rate notes, due 2040 ........ 2,000 5.67% 2,000 5.67%
Total ........................... 16,000 16,000
Other long-term debt ...................... 10 0.19% —
Unaccreted discount ...................... (70) (73)
Hedge accounting fair value adjustments ...... 357 307
Total long-term debt .............. $16,297 $16,234
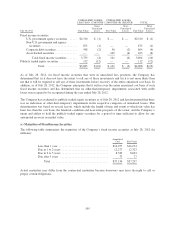
To achieve its interest rate risk management objectives, the Company entered into interest rate swaps with an
aggregate notional amount of $4.25 billion designated as fair value hedges of certain fixed-rate senior notes. In
effect, these swaps convert the fixed interest rates of the fixed-rate notes to floating interest rates based on the
London InterBank Offered Rate (“LIBOR”). The gains and losses related to changes in the fair value of the
interest rate swaps substantially offset changes in the fair value of the hedged portion of the underlying debt that
are attributable to the changes in market interest rates. See Note 11.
The effective rates for the fixed-rate debt include the interest on the notes, the accretion of the discount, and, if
applicable, adjustments related to hedging. Interest is payable semiannually on each class of the senior fixed-rate
notes and payable quarterly on the floating-rate notes. Each of the senior fixed-rate notes is redeemable by the
Company at any time, subject to a make-whole premium.
The senior notes rank at par with the issued commercial paper notes, as well as any other commercial paper notes
that may be issued in the future pursuant to the short-term debt financing program, as discussed earlier under
“Short-Term Debt.” As of July 28, 2012, the Company was in compliance with all debt covenants.
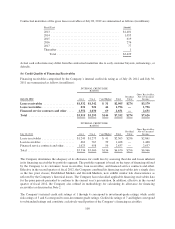
Future principal payments for long-term debt as of July 28, 2012 are summarized as follows (in millions):
Fiscal Year Amount
2013 ............................................. $ —
2014 ............................................. 3,260
2015 ............................................. 500
2016 ............................................. 3,000
2017 ............................................. 750
Thereafter ......................................... 8,500
Total ......................................... $16,010
110