Cisco 2012 Annual Report Download - page 53
Download and view the complete annual report
Please find page 53 of the 2012 Cisco annual report below. You can navigate through the pages in the report by either clicking on the pages listed below, or by using the keyword search tool below to find specific information within the annual report.-
 1
1 -
2
-
3
-
4
-
5
-
6
-
7
-
8
-
9
-
10
-
11
-
12
-
13
-
14
-
15
-
16
-
17
-
18
-
19
-
20
-
21
-
22
-
23
-
24
-
25
-
26
-
27
-
28
-
29
-
30
-
31
-
32
-
33
-
34
-
35
-
36
-
37
-
38
-
39
-
40
-
41
-
42
-
 43
43 -
 44
44 -
 45
45 -
 46
46 -
 47
47 -
 48
48 -
 49
49 -
 50
50 -
 51
51 -
 52
52 -
 53
53 -
 54
54 -
 55
55 -
 56
56 -
 57
57 -
 58
58 -
 59
59 -
 60
60 -
 61
61 -
 62
62 -
 63
63 -
64
-
65
-
66
-
67
-
68
-
69
-
70
-
71
-
72
-
73
-
74
-
75
-
76
-
77
-
78
-
79
-
80
-
81
-
82
-
83
-
84
-
85
-
86
-
87
-
88
-
89
-
90
-
91
-
92
-
93
-
94
-
95
-
96
-
97
-
98
-
99
-
100
-
101
-
102
-
103
-
104
-
105
-
106
-
107
-
108
-
109
-
110
-
111
-
112
-
113
-
114
-
115
-
116
-
117
-
118
-
119
-
120
-
121
-
122
-
123
-
124
-
125
-
126
-
127
-
128
-
129
-
130
-
131
-
132
-
133
-
134
-
135
-
136
-
137
-
138
-
139
-
140
-
141
-
142
-
143
-
144
-
145
-
146
-
147
-
148
-
149
-
150
-
151
-
152
 |
 |
ratings as well as assessing economic conditions, concentration of risk, and correlation are complex and
subjective. Our ongoing consideration of all these factors could result in an increase in our allowance for credit
loss in the future, which could adversely affect our revenue.
Both accounts receivable and financing receivables are charged off at the point when they are considered
uncollectible.
A reserve for future sales returns is established based on historical trends in product return rates. The reserve for
future sales returns as of July 28, 2012 and July 30, 2011 was $129 million and $106 million, respectively, and
was recorded as a reduction of our accounts receivable. If the actual future returns were to deviate from the
historical data on which the reserve had been established, our revenue could be adversely affected.
Inventory Valuation and Liability for Purchase Commitments with Contract Manufacturers and
Suppliers
Our inventory balance was $1.7 billion and $1.5 billion as of July 28, 2012 and July 30, 2011, respectively.
Inventory is written down based on excess and obsolete inventories determined primarily by future demand
forecasts. Inventory write-downs are measured as the difference between the cost of the inventory and market,
based upon assumptions about future demand, and are charged to the provision for inventory, which is a
component of our cost of sales. At the point of the loss recognition, a new, lower cost basis for that inventory is
established, and subsequent changes in facts and circumstances do not result in the restoration or increase in that
newly established cost basis.
We record a liability for firm, noncancelable, and unconditional purchase commitments with contract
manufacturers and suppliers for quantities in excess of our future demand forecasts consistent with the valuation
of our excess and obsolete inventory. As of July 28, 2012, the liability for these purchase commitments was $193
million, compared with $168 million as of July 30, 2011, and was included in other current liabilities.
Our provision for inventory was $115 million, $196 million, and $94 million for fiscal 2012, 2011, and 2010,
respectively. The provision for the liability related to purchase commitments with contract manufacturers and
suppliers was $151 million, $114 million, and $8 million in fiscal 2012, 2011, and 2010, respectively. On a
combined basis, the $44 million decline in our provisions for inventory and purchase commitments with contract
manufacturers and suppliers for fiscal 2012 was primarily due to the absence in the current fiscal year of charges
we recorded in connection with the restructuring and realignment of our consumer business during fiscal 2011. If
there were to be a sudden and significant decrease in demand for our products, or if there were a higher incidence
of inventory obsolescence because of rapidly changing technology and customer requirements, we could be
required to increase our inventory write-downs, and our liability for purchase commitments with contract
manufacturers and suppliers, and accordingly our profitability could be adversely affected. We regularly evaluate
our exposure for inventory write-downs and the adequacy of our liability for purchase commitments. Inventory
and supply chain management remain areas of focus as we balance the need to maintain supply chain flexibility
to help ensure competitive lead times with the risk of inventory obsolescence, particularly in light of current
macroeconomic uncertainties and conditions and the resulting potential for changes in future demand forecast.
Warranty Costs
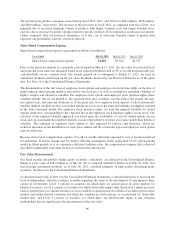
The liability for product warranties, included in other current liabilities, was $415 million as of July 28, 2012,
compared with $342 million as of July 30, 2011. See Note 12 to the Consolidated Financial Statements. Our
products are generally covered by a warranty for periods ranging from 90 days to five years, and for some
products we provide a limited lifetime warranty. We accrue for warranty costs as part of our cost of sales based
on associated material costs, technical support labor costs, and associated overhead. Material cost is estimated
based primarily upon historical trends in the volume of product returns within the warranty period and the cost to
repair or replace the equipment. Technical support labor cost is estimated based primarily upon historical trends
in the rate of customer cases and the cost to support the customer cases within the warranty period. Overhead
cost is applied based on estimated time to support warranty activities.
45