Cisco 2012 Annual Report Download - page 18
Download and view the complete annual report
Please find page 18 of the 2012 Cisco annual report below. You can navigate through the pages in the report by either clicking on the pages listed below, or by using the keyword search tool below to find specific information within the annual report.-
 1
1 -
2
-
3
-
4
-
5
-
6
-
7
-
 8
8 -
 9
9 -
 10
10 -
 11
11 -
 12
12 -
 13
13 -
 14
14 -
 15
15 -
 16
16 -
 17
17 -
 18
18 -
 19
19 -
 20
20 -
 21
21 -
 22
22 -
 23
23 -
 24
24 -
 25
25 -
 26
26 -
 27
27 -
 28
28 -
29
-
30
-
31
-
32
-
33
-
34
-
35
-
36
-
37
-
38
-
39
-
40
-
41
-
42
-
43
-
44
-
45
-
46
-
47
-
48
-
49
-
50
-
51
-
52
-
53
-
54
-
55
-
56
-
57
-
58
-
59
-
60
-
61
-
62
-
63
-
64
-
65
-
66
-
67
-
68
-
69
-
70
-
71
-
72
-
73
-
74
-
75
-
76
-
77
-
78
-
79
-
80
-
81
-
82
-
83
-
84
-
85
-
86
-
87
-
88
-
89
-
90
-
91
-
92
-
93
-
94
-
95
-
96
-
97
-
98
-
99
-
100
-
101
-
102
-
103
-
104
-
105
-
106
-
107
-
108
-
109
-
110
-
111
-
112
-
113
-
114
-
115
-
116
-
117
-
118
-
119
-
120
-
121
-
122
-
123
-
124
-
125
-
126
-
127
-
128
-
129
-
130
-
131
-
132
-
133
-
134
-
135
-
136
-
137
-
138
-
139
-
140
-
141
-
142
-
143
-
144
-
145
-
146
-
147
-
148
-
149
-
150
-
151
-
152
 |
 |
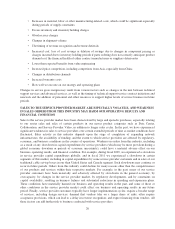
Distributors hold inventory and typically sell to systems integrators, service providers, and other resellers. In
addition, home networking products are generally sold through distributors and retail partners. We refer to sales
through distributors and retail partners as our two-tier system of sales to the end customer. Revenue from
distributors and retail partners is recognized based on a sell-through method using information provided by them.
These distributors and retail partners are generally given business terms that allow them to return a portion of
inventory, receive credits for changes in selling prices, and participate in various cooperative marketing
programs.
For information regarding risks related to our channels, see “Item 1A. Risk Factors,” including the risk factors
entitled “Disruption of or changes in our distribution model could harm our sales and margins” and “Our
inventory management relating to our sales to our two-tier distribution channel is complex, and excess inventory
may harm our gross margins.”
For information regarding risks relating to our international operations, see “Item 1A. Risk Factors,” including
the risk factors entitled “Our operating results may be adversely affected by unfavorable economic and market
conditions and the uncertain geopolitical environment”; “Entrance into new or developing markets exposes us to
additional competition and will likely increase demands on our service and support operations”; “Due to the
global nature of our operations, political or economic changes or other factors in a specific country or region
could harm our operating results and financial condition”; “We are exposed to fluctuations in currency exchange
rates that could negatively impact our financial results and cash flows”; and “Man-made problems such as
computer viruses or terrorism may disrupt our operations and harm our operating results,” among others.
Our service offerings complement our products through a range of consulting, technical, project, quality, and
maintenance services, including 24-hour online and telephone support through technical assistance centers.
Financing Arrangements
We provide financing arrangements for certain qualified customers to build, maintain, and upgrade their
networks. We believe customer financing is a competitive factor in obtaining business, particularly in serving
customers involved in significant infrastructure projects. Our financing arrangements include the following:
Leases:
• Sales-type
• Direct financing
• Operating
Loans
Financed service contracts
For additional information regarding these financing arrangements, see Note 7 to the Consolidated Financial
Statements.
Product Backlog
Our product backlog at July 28, 2012, the last day of our 2012 fiscal year, was approximately $5.0 billion,
compared with product backlog of approximately $4.5 billion at July 30, 2011, the last day of our 2011 fiscal
year. The product backlog includes orders confirmed for products scheduled to be shipped within 90 days to
customers with approved credit status. Because of the generally short cycle between order and shipment and
occasional customer changes in delivery schedules or cancellation of orders (which are made without significant
penalty), we do not believe that our product backlog, as of any particular date, is necessarily indicative of actual
net product sales for any future period.
10