Cisco 2012 Annual Report Download - page 90
Download and view the complete annual report
Please find page 90 of the 2012 Cisco annual report below. You can navigate through the pages in the report by either clicking on the pages listed below, or by using the keyword search tool below to find specific information within the annual report.-
 1
1 -
2
-
3
-
4
-
5
-
6
-
7
-
8
-
9
-
10
-
11
-
12
-
13
-
14
-
15
-
16
-
17
-
18
-
19
-
20
-
21
-
22
-
23
-
24
-
25
-
26
-
27
-
28
-
29
-
30
-
31
-
32
-
33
-
34
-
35
-
36
-
37
-
38
-
39
-
40
-
41
-
42
-
43
-
44
-
45
-
46
-
47
-
48
-
49
-
50
-
51
-
52
-
53
-
54
-
55
-
56
-
57
-
58
-
59
-
60
-
61
-
62
-
63
-
64
-
65
-
66
-
67
-
68
-
69
-
70
-
71
-
72
-
73
-
74
-
75
-
76
-
77
-
78
-
79
-
 80
80 -
 81
81 -
 82
82 -
 83
83 -
 84
84 -
 85
85 -
 86
86 -
 87
87 -
 88
88 -
 89
89 -
 90
90 -
 91
91 -
 92
92 -
 93
93 -
 94
94 -
 95
95 -
 96
96 -
 97
97 -
 98
98 -
 99
99 -
 100
100 -
101
-
102
-
103
-
104
-
105
-
106
-
107
-
108
-
109
-
110
-
111
-
112
-
113
-
114
-
115
-
116
-
117
-
118
-
119
-
120
-
121
-
122
-
123
-
124
-
125
-
126
-
127
-
128
-
129
-
130
-
131
-
132
-
133
-
134
-
135
-
136
-
137
-
138
-
139
-
140
-
141
-
142
-
143
-
144
-
145
-
146
-
147
-
148
-
149
-
150
-
151
-
152
 |
 |

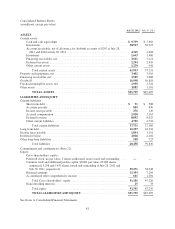
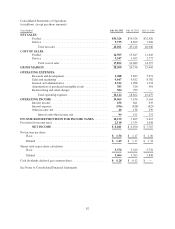
Consolidated Statements of Operations
(in millions, except per-share amounts)
Years Ended July 28, 2012 July 30, 2011 July 31, 2010
NET SALES:
Product ............................................ $36,326 $34,526 $32,420
Service ............................................ 9,735 8,692 7,620
Total net sales ................................... 46,061 43,218 40,040
COST OF SALES:
Product ............................................ 14,505 13,647 11,620
Service ............................................ 3,347 3,035 2,777
Total cost of sales ................................ 17,852 16,682 14,397
GROSS MARGIN ........................................... 28,209 26,536 25,643
OPERATING EXPENSES:
Research and development ............................. 5,488 5,823 5,273
Sales and marketing .................................. 9,647 9,812 8,782
General and administrative ............................. 2,322 1,908 1,933
Amortization of purchased intangible assets ............... 383 520 491
Restructuring and other charges ......................... 304 799 —
Total operating expenses .......................... 18,144 18,862 16,479
OPERATING INCOME ..................................... 10,065 7,674 9,164
Interest income ...................................... 650 641 635
Interest expense ..................................... (596) (628) (623)
Other income, net .................................... 40 138 239
Interest and other income, net ....................... 94 151 251
INCOME BEFORE PROVISION FOR INCOME TAXES ......... 10,159 7,825 9,415
Provision for income taxes ..................................... 2,118 1,335 1,648
NET INCOME ..................................... $ 8,041 $ 6,490 $ 7,767
Net income per share
Basic .................................................. $ 1.50 $ 1.17 $ 1.36
Diluted ................................................ $ 1.49 $ 1.17 $ 1.33
Shares used in per-share calculation
Basic .................................................. 5,370 5,529 5,732
Diluted ................................................ 5,404 5,563 5,848
Cash dividends declared per common share ........................ $ 0.28 $ 0.12 $ —
See Notes to Consolidated Financial Statements.
82