Cisco 2012 Annual Report Download - page 50
Download and view the complete annual report
Please find page 50 of the 2012 Cisco annual report below. You can navigate through the pages in the report by either clicking on the pages listed below, or by using the keyword search tool below to find specific information within the annual report.-
 1
1 -
2
-
3
-
4
-
5
-
6
-
7
-
8
-
9
-
10
-
11
-
12
-
13
-
14
-
15
-
16
-
17
-
18
-
19
-
20
-
21
-
22
-
23
-
24
-
25
-
26
-
27
-
28
-
29
-
30
-
31
-
32
-
33
-
34
-
35
-
36
-
37
-
38
-
39
-
 40
40 -
 41
41 -
 42
42 -
 43
43 -
 44
44 -
 45
45 -
 46
46 -
 47
47 -
 48
48 -
 49
49 -
 50
50 -
 51
51 -
 52
52 -
 53
53 -
 54
54 -
 55
55 -
 56
56 -
 57
57 -
 58
58 -
 59
59 -
 60
60 -
61
-
62
-
63
-
64
-
65
-
66
-
67
-
68
-
69
-
70
-
71
-
72
-
73
-
74
-
75
-
76
-
77
-
78
-
79
-
80
-
81
-
82
-
83
-
84
-
85
-
86
-
87
-
88
-
89
-
90
-
91
-
92
-
93
-
94
-
95
-
96
-
97
-
98
-
99
-
100
-
101
-
102
-
103
-
104
-
105
-
106
-
107
-
108
-
109
-
110
-
111
-
112
-
113
-
114
-
115
-
116
-
117
-
118
-
119
-
120
-
121
-
122
-
123
-
124
-
125
-
126
-
127
-
128
-
129
-
130
-
131
-
132
-
133
-
134
-
135
-
136
-
137
-
138
-
139
-
140
-
141
-
142
-
143
-
144
-
145
-
146
-
147
-
148
-
149
-
150
-
151
-
152
 |
 |

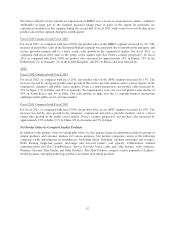
challenges in fiscal 2013. In particular, we expect to be impacted by continued weakness in the European
economy, lower global public sector spending especially with regard to the U.S. federal government and
European governments, and a continued conservative approach to IT-related capital spending as our customers
respond to this difficult macroeconomic environment.
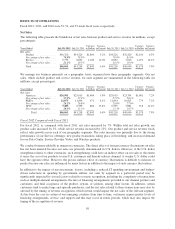
Fourth Quarter Snapshot
For the fourth quarter of fiscal 2012, as compared with the corresponding period in fiscal 2011, net sales
increased by 4%, with net product sales increasing by 3% and service revenue increasing by 12%. With regard to
our geographic segment performance, on a year-over-year basis, net sales increased by 7% in the Americas,
decreased by 5% in EMEA, and increased by 9% in APJC. Total gross margin decreased by 0.7 percentage
points, primarily as a result of higher sales discounts and unfavorable product pricing as well as unfavorable
product mix shifts, partially offset by lower manufacturing costs and higher volume. As a percentage of revenue,
research and development, sales and marketing, and general and administrative expenses collectively declined by
1.6 percentage points. For the fourth quarter of fiscal 2012, general and administrative expenses include $202
million of real estate charges, primarily related to impairment charges on real estate held for sale. Operating
income as a percentage of revenue increased by 7.3 percentage points, primarily as a result of lower restructuring
and other charges in the fourth quarter of fiscal 2012 and our sales increase. Diluted earnings per share increased
by 64% from the prior year period, primarily as a result of a 56% increase in net income and also, to a lesser
degree, from a decline of 142 million in our diluted share count.
Strategy and Focus Areas
We began in fiscal 2011, and had largely completed by the end of fiscal 2012, realigning our sales, services and
engineering organizations in order to simplify our operating model, drive faster innovation, and focus on our five
foundational priorities:
• Leadership in our core business (routing, switching, and associated services) which includes
comprehensive security and mobility solutions
• Collaboration
• Data center virtualization and cloud
• Video
• Architectures for business transformation
We believe that focusing on these priorities best positions us to continue to expand our share of our customers’
information technology spending. For a full discussion of our strategy and focus areas, see Item 1. Business.
Other Key Financial Measures
The following is a summary of our other key financial measures for fiscal 2012 compared with fiscal 2011 (in
millions, except days sales outstanding in accounts receivable (“DSO”) and annualized inventory turns):
Fiscal
2012
Fiscal
2011
Cash and cash equivalents and investments ............................. $48,716 $44,585
Cash provided by operating activities .................................. $11,491 $10,079
Deferred revenue .................................................. $12,880 $12,207
Repurchases of common stock--stock repurchase program ................. $ 4,360 $ 6,791
Dividends ....................................................... $ 1,501 $ 658
DSO............................................................ 34 days 38 days
Inventories ....................................................... $ 1,663 $ 1,486
Annualized inventory turns .......................................... 11.7 11.8
Our product backlog at the end of fiscal 2012 was $5.0 billion, or 11% of fiscal 2012 net sales, compared with
$4.5 billion at the end of fiscal 2011, or 10% of fiscal 2011 net sales.
42