Cisco 2012 Annual Report Download - page 131
Download and view the complete annual report
Please find page 131 of the 2012 Cisco annual report below. You can navigate through the pages in the report by either clicking on the pages listed below, or by using the keyword search tool below to find specific information within the annual report.-
 1
1 -
2
-
3
-
4
-
5
-
6
-
7
-
8
-
9
-
10
-
11
-
12
-
13
-
14
-
15
-
16
-
17
-
18
-
19
-
20
-
21
-
22
-
23
-
24
-
25
-
26
-
27
-
28
-
29
-
30
-
31
-
32
-
33
-
34
-
35
-
36
-
37
-
38
-
39
-
40
-
41
-
42
-
43
-
44
-
45
-
46
-
47
-
48
-
49
-
50
-
51
-
52
-
53
-
54
-
55
-
56
-
57
-
58
-
59
-
60
-
61
-
62
-
63
-
64
-
65
-
66
-
67
-
68
-
69
-
70
-
71
-
72
-
73
-
74
-
75
-
76
-
77
-
78
-
79
-
80
-
81
-
82
-
83
-
84
-
85
-
86
-
87
-
88
-
89
-
90
-
91
-
92
-
93
-
94
-
95
-
96
-
97
-
98
-
99
-
100
-
101
-
102
-
103
-
104
-
105
-
106
-
107
-
108
-
109
-
110
-
111
-
112
-
113
-
114
-
115
-
116
-
117
-
118
-
119
-
120
-
 121
121 -
 122
122 -
 123
123 -
 124
124 -
 125
125 -
 126
126 -
 127
127 -
 128
128 -
 129
129 -
 130
130 -
 131
131 -
 132
132 -
 133
133 -
 134
134 -
 135
135 -
 136
136 -
 137
137 -
 138
138 -
 139
139 -
 140
140 -
 141
141 -
142
-
143
-
144
-
145
-
146
-
147
-
148
-
149
-
150
-
151
-
152
 |
 |

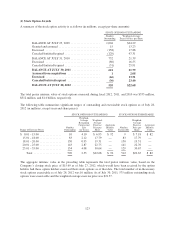
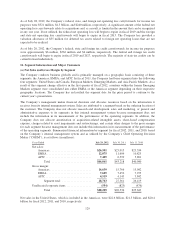
(f) Stock Option Awards
A summary of the stock option activity is as follows (in millions, except per-share amounts):
STOCK OPTIONS OUTSTANDING
Number
Outstanding
Weighted-Average
Exercise Price per Share
BALANCE AT JULY 25, 2009 .................... 1,004 $24.29
Granted and assumed ............................ 15 13.23
Exercised ..................................... (158) 17.88
Canceled/forfeited/expired ........................ (129) 47.31
BALANCE AT JULY 31, 2010 .................... 732 21.39
Exercised ..................................... (80) 16.55
Canceled/forfeited/expired ........................ (31) 25.91
BALANCE AT JULY 30, 2011 ................... 621 21.79
Assumed from acquisitions ...................... 1 2.08
Exercised ..................................... (66) 13.51
Canceled/forfeited/expired ...................... (36) 23.40
BALANCE AT JULY 28, 2012 ................... 520 $22.68
The total pretax intrinsic value of stock options exercised during fiscal 2012, 2011, and 2010 was $333 million,
$312 million, and $1.0 billion, respectively.
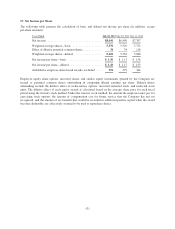
The following table summarizes significant ranges of outstanding and exercisable stock options as of July 28,
2012 (in millions, except years and share prices):
STOCK OPTIONS OUTSTANDING STOCK OPTIONS EXERCISABLE
Range of Exercise Prices
Number
Outstanding
Weighted-
Average
Remaining
Contractual
Life
(in Years)
Weighted-
Average
Exercise
Price per
Share
Aggregate
Intrinsic
Value
Number
Exercisable
Weighted-
Average
Exercise
Price per
Share
Aggregate
Intrinsic
Value
$ 0.01 – 15.00 ............... 10 4.10 $ 6.95 $ 92 9 $ 7.18 $ 82
15.01 – 18.00 ............... 83 2.12 17.79 — 83 17.79 —
18.01 – 20.00 ............... 150 0.93 19.31 — 150 19.31 —
20.01 – 25.00 ............... 143 2.87 22.75 — 141 22.76 —
25.01 – 35.00 ............... 134 4.08 30.64 — 129 30.67 —
Total ................... 520 2.53 $22.68 $ 92 512 $22.65 $ 82
The aggregate intrinsic value in the preceding table represents the total pretax intrinsic value, based on the
Company’s closing stock price of $15.69 as of July 27, 2012, which would have been received by the option
holders had those option holders exercised their stock options as of that date. The total number of in-the-money
stock options exercisable as of July 28, 2012 was 10 million. As of July 30, 2011, 575 million outstanding stock
options were exercisable and the weighted-average exercise price was $21.37.
123