Cisco 2012 Annual Report Download - page 117
Download and view the complete annual report
Please find page 117 of the 2012 Cisco annual report below. You can navigate through the pages in the report by either clicking on the pages listed below, or by using the keyword search tool below to find specific information within the annual report.-
 1
1 -
2
-
3
-
4
-
5
-
6
-
7
-
8
-
9
-
10
-
11
-
12
-
13
-
14
-
15
-
16
-
17
-
18
-
19
-
20
-
21
-
22
-
23
-
24
-
25
-
26
-
27
-
28
-
29
-
30
-
31
-
32
-
33
-
34
-
35
-
36
-
37
-
38
-
39
-
40
-
41
-
42
-
43
-
44
-
45
-
46
-
47
-
48
-
49
-
50
-
51
-
52
-
53
-
54
-
55
-
56
-
57
-
58
-
59
-
60
-
61
-
62
-
63
-
64
-
65
-
66
-
67
-
68
-
69
-
70
-
71
-
72
-
73
-
74
-
75
-
76
-
77
-
78
-
79
-
80
-
81
-
82
-
83
-
84
-
85
-
86
-
87
-
88
-
89
-
90
-
91
-
92
-
93
-
94
-
95
-
96
-
97
-
98
-
99
-
100
-
101
-
102
-
103
-
104
-
105
-
106
-
 107
107 -
 108
108 -
 109
109 -
 110
110 -
 111
111 -
 112
112 -
 113
113 -
 114
114 -
 115
115 -
 116
116 -
 117
117 -
 118
118 -
 119
119 -
 120
120 -
 121
121 -
 122
122 -
 123
123 -
 124
124 -
 125
125 -
 126
126 -
 127
127 -
128
-
129
-
130
-
131
-
132
-
133
-
134
-
135
-
136
-
137
-
138
-
139
-
140
-
141
-
142
-
143
-
144
-
145
-
146
-
147
-
148
-
149
-
150
-
151
-
152
 |
 |

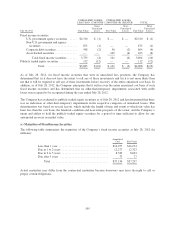
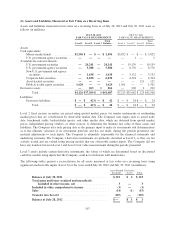
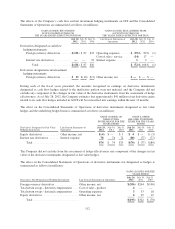
The fair value of purchased intangible assets measured at fair value on a nonrecurring basis was categorized as
Level 3 due to the use of significant unobservable inputs in the valuation. Significant unobservable inputs that
were used included expected revenues and net income related to the assets and the expected life of the assets. The
difference between the estimated fair value and the carrying value of the assets was recorded as an impairment
charge. For the years ended July 28, 2012, July 30, 2011, and July 31, 2010, such impairment charges were
recorded in cost of sales and operating expenses as appropriate. See Note 4.
The loss related to the manufacturing operations held for sale was primarily related to a reduction in goodwill
related to the sale of the Company’s set-top box manufacturing operations in Juarez, Mexico. See Note 5. This
goodwill reduction represents the difference between the carrying value and the implied fair value of the
goodwill associated with the disposal group being evaluated.
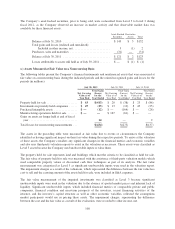
(d) Other Fair Value Disclosures
As of July 28, 2012, the carrying value of the Company’s investments in privately held companies that were
accounted for under the cost method was $249 million. It was not practicable to estimate the fair value of this
portfolio.
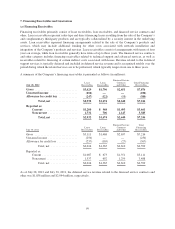
The fair value of the Company’s short-term loan receivables and financed service contracts approximates their
carrying value due to their short duration.
The aggregate carrying value of the Company’s long-term loan receivables and financed service contracts and
other as of July 28, 2012 and July 30, 2011 was $1.9 billion and $2.0 billion, respectively. The estimated fair
value of the Company’s long-term loan receivables and financed service contracts and other approximates their
carrying value. The Company uses significant unobservable inputs in determining discounted cash flows to
estimate the fair value of its long-term loan receivables and financed service contracts and therefore they are
categorized as Level 3.
As of July 28, 2012, the fair value of the Company’s long-term debt was $18.8 billion with a carrying amount of
$16.3 billion. This compares to a fair value of $17.4 billion and a carrying amount of $16.2 billion as of July 30,
2011. The fair value of the long-term debt was determined based on observable market prices in a less active
market and was categorized as Level 2 in the fair value hierarchy.
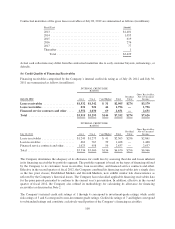
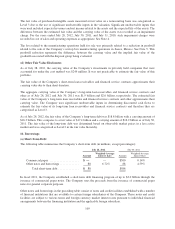
10. Borrowings
(a) Short-Term Debt
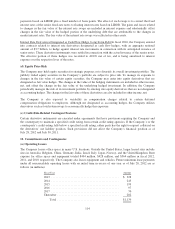
The following table summarizes the Company’s short-term debt (in millions, except percentages):
July 28, 2012 July 30, 2011
Amount
Weighted-Average
Interest Rate Amount
Weighted-Average
Interest Rate
Commercial paper .................... $— — $500 0.14%
Other notes and borrowings ............. 31 6.72% 88 4.59%
Total short-term debt .............. $31 $588
In fiscal 2011, the Company established a short-term debt financing program of up to $3.0 billion through the
issuance of commercial paper notes. The Company uses the proceeds from the issuance of commercial paper
notes for general corporate purposes.
Other notes and borrowings in the preceding table consist of notes and credit facilities established with a number
of financial institutions that are available to certain foreign subsidiaries of the Company. These notes and credit
facilities are subject to various terms and foreign currency market interest rates pursuant to individual financial
arrangements between the financing institution and the applicable foreign subsidiary.
109