Cisco 2012 Annual Report Download - page 64
Download and view the complete annual report
Please find page 64 of the 2012 Cisco annual report below. You can navigate through the pages in the report by either clicking on the pages listed below, or by using the keyword search tool below to find specific information within the annual report.-
 1
1 -
2
-
3
-
4
-
5
-
6
-
7
-
8
-
9
-
10
-
11
-
12
-
13
-
14
-
15
-
16
-
17
-
18
-
19
-
20
-
21
-
22
-
23
-
24
-
25
-
26
-
27
-
28
-
29
-
30
-
31
-
32
-
33
-
34
-
35
-
36
-
37
-
38
-
39
-
40
-
41
-
42
-
43
-
44
-
45
-
46
-
47
-
48
-
49
-
50
-
51
-
52
-
53
-
 54
54 -
 55
55 -
 56
56 -
 57
57 -
 58
58 -
 59
59 -
 60
60 -
 61
61 -
 62
62 -
 63
63 -
 64
64 -
 65
65 -
 66
66 -
 67
67 -
 68
68 -
 69
69 -
 70
70 -
 71
71 -
 72
72 -
 73
73 -
 74
74 -
75
-
76
-
77
-
78
-
79
-
80
-
81
-
82
-
83
-
84
-
85
-
86
-
87
-
88
-
89
-
90
-
91
-
92
-
93
-
94
-
95
-
96
-
97
-
98
-
99
-
100
-
101
-
102
-
103
-
104
-
105
-
106
-
107
-
108
-
109
-
110
-
111
-
112
-
113
-
114
-
115
-
116
-
117
-
118
-
119
-
120
-
121
-
122
-
123
-
124
-
125
-
126
-
127
-
128
-
129
-
130
-
131
-
132
-
133
-
134
-
135
-
136
-
137
-
138
-
139
-
140
-
141
-
142
-
143
-
144
-
145
-
146
-
147
-
148
-
149
-
150
-
151
-
152
 |
 |

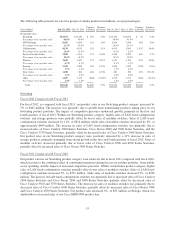
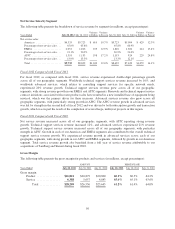
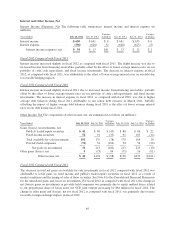
Net Service Sales by Segment
The following table presents the breakdown of service revenue by segment (in millions, except percentages):
Years Ended July 28, 2012 July 30, 2011
Variance
in Dollars
Variance
in Percent July 30, 2011 July 31, 2010
Variance
in Dollars
Variance
in Percent
Net service sales:
Americas ................... $6,333 $5,723 $ 610 10.7% $5,723 $5,094 $ 629 12.3%
Percentage of net service sales . . . 65.0% 65.8% 65.8% 66.9%
EMEA ..................... 2,051 1,816 235 12.9% 1,816 1,602 214 13.4%
Percentage of net service sales . . . 21.1% 20.9% 20.9% 21.0%
APJC ...................... 1,351 1,153 198 17.2% 1,153 924 229 24.8%
Percentage of net service sales . . . 13.9% 13.3% 13.3% 12.1%
Total ....................... $9,735 $8,692 $1,043 12.0% $8,692 $7,620 $1,072 14.1%
Fiscal 2012 Compared with Fiscal 2011
For fiscal 2012, as compared with fiscal 2011, service revenue experienced double-digit percentage growth
across all of our geographic segments. Worldwide technical support services revenue increased by 10%, and
worldwide advanced services, which relates to consulting support services for specific network needs,
experienced 20% revenue growth. Technical support services revenue grew across all of our geographic
segments, with strong revenue growth in our EMEA and APJC segments. Renewals and technical support service
contract initiations associated with recent product sales have resulted in a new installed base of equipment being
serviced, which was the primary driver for these increases. Advanced services revenue also grew across all
geographic segments, with particularly strong growth in APJC. The APJC revenue growth in advanced services
was led by strength in the second half of fiscal 2012 and was driven by both subscription growth and transaction
growth, which was in part the result of the completion of several large, multiyear projects in this region.
Fiscal 2011 Compared with Fiscal 2010
Net service revenue increased across all of our geographic segments, with APJC reporting strong revenue
growth. Technical support services revenue increased 12%, and advanced services experienced 21% revenue
growth. Technical support service revenue increased across all of our geographic segments, with particular
strength in APJC. Growth in each of our Americas and EMEA segments also contributed to the overall technical
support service revenue growth. We experienced revenue growth in advanced services across each of our
geographic segments, with strong growth in our APJC and EMEA segments, followed by growth in our Americas
segment. Total service revenue growth also benefited from a full year of service revenue attributable to our
acquisitions of Tandberg and Starent during fiscal 2010.
Gross Margin
The following table presents the gross margin for products and services (in millions, except percentages):
AMOUNT PERCENTAGE
Years Ended July 28, 2012 July 30, 2011 July 31, 2010 July 28, 2012 July 30, 2011 July 31, 2010
Gross margin:
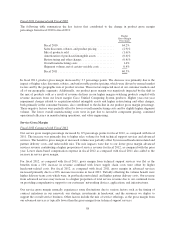
Product ................ $21,821 $20,879 $20,800 60.1% 60.5% 64.2%
Service ................ 6,388 5,657 4,843 65.6% 65.1% 63.6%
Total .............. $28,209 $26,536 $25,643 61.2% 61.4% 64.0%
56