Cisco 2012 Annual Report Download - page 65
Download and view the complete annual report
Please find page 65 of the 2012 Cisco annual report below. You can navigate through the pages in the report by either clicking on the pages listed below, or by using the keyword search tool below to find specific information within the annual report.-
 1
1 -
2
-
3
-
4
-
5
-
6
-
7
-
8
-
9
-
10
-
11
-
12
-
13
-
14
-
15
-
16
-
17
-
18
-
19
-
20
-
21
-
22
-
23
-
24
-
25
-
26
-
27
-
28
-
29
-
30
-
31
-
32
-
33
-
34
-
35
-
36
-
37
-
38
-
39
-
40
-
41
-
42
-
43
-
44
-
45
-
46
-
47
-
48
-
49
-
50
-
51
-
52
-
53
-
54
-
 55
55 -
 56
56 -
 57
57 -
 58
58 -
 59
59 -
 60
60 -
 61
61 -
 62
62 -
 63
63 -
 64
64 -
 65
65 -
 66
66 -
 67
67 -
 68
68 -
 69
69 -
 70
70 -
 71
71 -
 72
72 -
 73
73 -
 74
74 -
 75
75 -
76
-
77
-
78
-
79
-
80
-
81
-
82
-
83
-
84
-
85
-
86
-
87
-
88
-
89
-
90
-
91
-
92
-
93
-
94
-
95
-
96
-
97
-
98
-
99
-
100
-
101
-
102
-
103
-
104
-
105
-
106
-
107
-
108
-
109
-
110
-
111
-
112
-
113
-
114
-
115
-
116
-
117
-
118
-
119
-
120
-
121
-
122
-
123
-
124
-
125
-
126
-
127
-
128
-
129
-
130
-
131
-
132
-
133
-
134
-
135
-
136
-
137
-
138
-
139
-
140
-
141
-
142
-
143
-
144
-
145
-
146
-
147
-
148
-
149
-
150
-
151
-
152
 |
 |

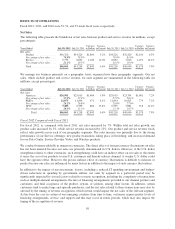
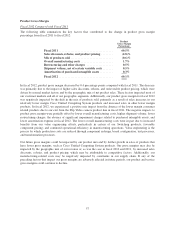
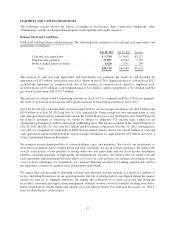
Product Gross Margin
Fiscal 2012 Compared with Fiscal 2011
The following table summarizes the key factors that contributed to the change in product gross margin
percentage from fiscal 2011 to fiscal 2012:
Product
Gross Margin
Percentage
Fiscal 2011 ..................................... 60.5%
Sales discounts, rebates, and product pricing ........ (2.8)%
Mix of products sold ............................. (0.6)%
Overall manufacturing costs ...................... 1.7%
Restructuring and other charges .................. 0.5%
Shipment volume, net of certain variable costs ....... 0.5%
Amortization of purchased intangible assets ......... 0.3%
Fiscal 2012 ..................................... 60.1%
In fiscal 2012, product gross margin decreased by 0.4 percentage points compared with fiscal 2011. The decrease
was primarily due to the impact of higher sales discounts, rebates, and unfavorable product pricing, which were
driven by normal market factors and by the geographic mix of net product sales. These factors impacted most of
our customer markets and all of our geographic segments. Additionally, our product gross margin for fiscal 2012
was negatively impacted by the shift in the mix of products sold, primarily as a result of sales increases in our
relatively lower margin Cisco Unified Computing System products and increased sales in other lower margin
products. In fiscal 2012, we experienced a positive mix impact from the absence of the lower margin consumer
related products due to our exit from the Flip Video camera product line in fiscal 2011. The negative impacts to
product gross margin were partially offset by lower overall manufacturing costs, higher shipment volume, lower
restructuring charges, the absence of significant impairment charges related to purchased intangible assets, and
lower amortization expense in fiscal 2012. The lower overall manufacturing costs were in part due to increased
benefits from our value engineering efforts, particularly in certain of our Switching products; favorable
component pricing; and continued operational efficiency in manufacturing operations. Value engineering is the
process by which production costs are reduced through component redesign, board configuration, test processes,
and transformation processes.
Our future gross margins could be impacted by our product mix and by further growth in sales of products that
have lower gross margins, such as Cisco Unified Computing System products. Our gross margins may also be
impacted by the geographic mix of our revenue or, as was the case in fiscal 2012 and 2011, by increased sales
discounts, rebates, and product pricing, which may be attributable to competitive factors. Additionally, our
manufacturing-related costs may be negatively impacted by constraints in our supply chain. If any of the
preceding factors that impact our gross margins are adversely affected in future periods, our product and service
gross margins could continue to decline.
57