Cisco 2012 Annual Report Download - page 76
Download and view the complete annual report
Please find page 76 of the 2012 Cisco annual report below. You can navigate through the pages in the report by either clicking on the pages listed below, or by using the keyword search tool below to find specific information within the annual report.-
 1
1 -
2
-
3
-
4
-
5
-
6
-
7
-
8
-
9
-
10
-
11
-
12
-
13
-
14
-
15
-
16
-
17
-
18
-
19
-
20
-
21
-
22
-
23
-
24
-
25
-
26
-
27
-
28
-
29
-
30
-
31
-
32
-
33
-
34
-
35
-
36
-
37
-
38
-
39
-
40
-
41
-
42
-
43
-
44
-
45
-
46
-
47
-
48
-
49
-
50
-
51
-
52
-
53
-
54
-
55
-
56
-
57
-
58
-
59
-
60
-
61
-
62
-
63
-
64
-
65
-
 66
66 -
 67
67 -
 68
68 -
 69
69 -
 70
70 -
 71
71 -
 72
72 -
 73
73 -
 74
74 -
 75
75 -
 76
76 -
 77
77 -
 78
78 -
 79
79 -
 80
80 -
 81
81 -
 82
82 -
 83
83 -
 84
84 -
 85
85 -
 86
86 -
87
-
88
-
89
-
90
-
91
-
92
-
93
-
94
-
95
-
96
-
97
-
98
-
99
-
100
-
101
-
102
-
103
-
104
-
105
-
106
-
107
-
108
-
109
-
110
-
111
-
112
-
113
-
114
-
115
-
116
-
117
-
118
-
119
-
120
-
121
-
122
-
123
-
124
-
125
-
126
-
127
-
128
-
129
-
130
-
131
-
132
-
133
-
134
-
135
-
136
-
137
-
138
-
139
-
140
-
141
-
142
-
143
-
144
-
145
-
146
-
147
-
148
-
149
-
150
-
151
-
152
 |
 |

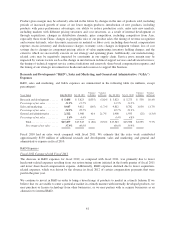
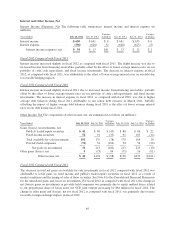
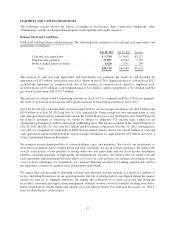
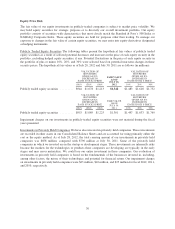
Accounts Receivable, Net The following table summarizes our accounts receivable, net (in millions), and DSO:
July 28, 2012 July 30, 2011 Decrease
Accounts receivable, net ....................... $4,369 $4,698 $(329)
DSO ...................................... 34 38 (4)
Our accounts receivable net, as of July 28, 2012 decreased by approximately 7% compared with the end of fiscal
2011. Our DSO as of July 28, 2012 was lower by 4 days compared with the end of fiscal 2011. The decrease in
DSO was due to an improvement in shipment linearity during the fourth quarter of fiscal 2012, compared with
the fourth quarter of fiscal 2011.
Services billings have traditionally had the effect of increasing DSO due in part to the timing of billings, which in
comparison to product billings, have a larger proportion billed in the latter part of the quarter. Given various
factors such as our business mix, linearity, and the growth of our service business, going forward we expect DSO
to continue to be in the range of 30 to 40 days.
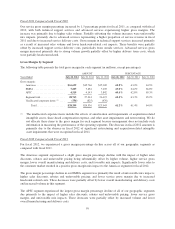
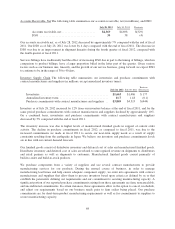
Inventory Supply Chain The following table summarizes our inventories and purchase commitments with
contract manufacturers and suppliers (in millions, except annualized inventory turns):
July 28, 2012 July 30, 2011
Increase
(Decrease)
Inventories .............................................. $1,663 $1,486 $ 177
Annualized inventory turns ................................. 11.7 11.8 (0.1)
Purchase commitments with contract manufacturers and suppliers . . $3,869 $4,313 $(444)
Inventory as of July 28, 2012 increased by 12% from our inventory balance at the end of fiscal 2011, and for the
same period purchase commitments with contract manufacturers and suppliers declined by approximately 10%.
On a combined basis, inventories and purchase commitments with contract manufacturers and suppliers
decreased by 5% compared with the end of fiscal 2011.
The inventory increase was due to higher levels of manufactured finished goods in support of current order
activity. The decline in purchase commitments in fiscal 2012, as compared to fiscal 2011, was due to the
increased commitments we made in fiscal 2011 to secure our near-term supply needs as a result of supply
constraints resulting from the earthquake in Japan. We believe our inventory and purchase commitments levels
are in line with our current demand forecasts.
Our finished goods consist of distributor inventory and deferred cost of sales and manufactured finished goods.
Distributor inventory and deferred cost of sales are related to unrecognized revenue on shipments to distributors
and retail partners as well as shipments to customers. Manufactured finished goods consist primarily of
build-to-order and build-to-stock products.
We purchase components from a variety of suppliers and use several contract manufacturers to provide
manufacturing services for our products. During the normal course of business, in order to manage
manufacturing lead times and help ensure adequate component supply, we enter into agreements with contract
manufacturers and suppliers that allow them to procure inventory based upon criteria as defined by us or that
establish the parameters defining our requirements and our commitment to securing manufacturing capacity. A
significant portion of our reported purchase commitments arising from these agreements are firm, noncancelable,
and unconditional commitments. In certain instances, these agreements allow us the option to cancel, reschedule,
and adjust our requirements based on our business needs prior to firm orders being placed. Our purchase
commitments are for short-term product manufacturing requirements as well as for commitments to suppliers to
secure manufacturing capacity.
68