Cisco 2012 Annual Report Download - page 115
Download and view the complete annual report
Please find page 115 of the 2012 Cisco annual report below. You can navigate through the pages in the report by either clicking on the pages listed below, or by using the keyword search tool below to find specific information within the annual report.-
 1
1 -
2
-
3
-
4
-
5
-
6
-
7
-
8
-
9
-
10
-
11
-
12
-
13
-
14
-
15
-
16
-
17
-
18
-
19
-
20
-
21
-
22
-
23
-
24
-
25
-
26
-
27
-
28
-
29
-
30
-
31
-
32
-
33
-
34
-
35
-
36
-
37
-
38
-
39
-
40
-
41
-
42
-
43
-
44
-
45
-
46
-
47
-
48
-
49
-
50
-
51
-
52
-
53
-
54
-
55
-
56
-
57
-
58
-
59
-
60
-
61
-
62
-
63
-
64
-
65
-
66
-
67
-
68
-
69
-
70
-
71
-
72
-
73
-
74
-
75
-
76
-
77
-
78
-
79
-
80
-
81
-
82
-
83
-
84
-
85
-
86
-
87
-
88
-
89
-
90
-
91
-
92
-
93
-
94
-
95
-
96
-
97
-
98
-
99
-
100
-
101
-
102
-
103
-
104
-
 105
105 -
 106
106 -
 107
107 -
 108
108 -
 109
109 -
 110
110 -
 111
111 -
 112
112 -
 113
113 -
 114
114 -
 115
115 -
 116
116 -
 117
117 -
 118
118 -
 119
119 -
 120
120 -
 121
121 -
 122
122 -
 123
123 -
 124
124 -
 125
125 -
126
-
127
-
128
-
129
-
130
-
131
-
132
-
133
-
134
-
135
-
136
-
137
-
138
-
139
-
140
-
141
-
142
-
143
-
144
-
145
-
146
-
147
-
148
-
149
-
150
-
151
-
152
 |
 |

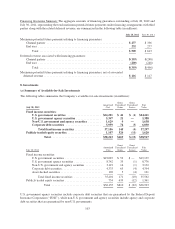
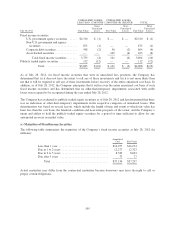
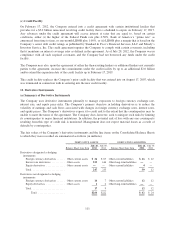
(b) Assets and Liabilities Measured at Fair Value on a Recurring Basis
Assets and liabilities measured at fair value on a recurring basis as of July 28, 2012 and July 30, 2011 were as
follows (in millions):
JULY 28, 2012
FAIR VALUE MEASUREMENTS
JULY 30, 2011
FAIR VALUE MEASUREMENTS
Level 1 Level 2 Level 3
Total
Balance Level 1 Level 2 Level 3
Total
Balance
Assets
Cash equivalents:
Money market funds ...............$2,506 $ — $ — $ 2,506 $5,852 $ — $ — $ 5,852
U.S. government agency securities .... ———— —1—1
Available-for-sale investments:
U.S. government securities .......... — 24,241 — 24,241 — 19,139 — 19,139
U.S. government agency securities .... — 5,388 — 5,388 — 8,776 — 8,776
Non-U.S. government and agency
securities ...................... — 1,638 — 1,638 — 3,132 — 3,132
Corporate debt securities ............ — 6,030 — 6,030 — 4,394 — 4,394
Asset-backed securities ............. ———— — — 121 121
Publicly traded equity securities ...... 1,620 — — 1,620 1,361 — — 1,361
Derivative assets ...................... — 263 1 264 — 220 2 222
Total ........................$4,126 $37,560 $ 1 $41,687 $7,213 $35,662 $ 123 $42,998
Liabilities:
Derivative liabilities ...............$—$ 42$—$ 42 $—$ 24$—$ 24
Total ........................$—$ 42$—$ 42 $—$ 24$—$ 24
Level 2 fixed income securities are priced using quoted market prices for similar instruments or nonbinding
market prices that are corroborated by observable market data. The Company uses inputs such as actual trade
data, benchmark yields, broker/dealer quotes, and other similar data, which are obtained from quoted market
prices, independent pricing vendors, or other sources, to determine the ultimate fair value of these assets and
liabilities. The Company uses such pricing data as the primary input to make its assessments and determinations
as to the ultimate valuation of its investment portfolio and has not made, during the periods presented, any
material adjustments to such inputs. The Company is ultimately responsible for the financial statements and
underlying estimates. The Company’s derivative instruments are primarily classified as Level 2, as they are not
actively traded and are valued using pricing models that use observable market inputs. The Company did not
have any transfers between Level 1 and Level 2 fair value measurements during the periods presented.
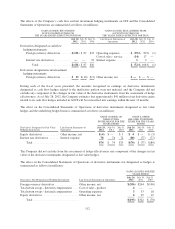
Level 3 assets include certain derivative instruments, the values of which are determined based on discounted
cash flow models using inputs that the Company could not corroborate with market data.
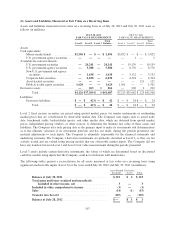
The following tables present a reconciliation for all assets measured at fair value on a recurring basis using
significant unobservable inputs (Level 3) for the years ended July 28, 2012 and July 30, 2011 (in millions):
Asset-Backed
Securities
Derivative
Assets Total
Balance at July 30, 2011 ............................... $ 121 $ 2 $ 123
Total gains and losses (realized and unrealized):
Included in other income, net ...................... 3— 3
Included in other comprehensive income ................. (3) — (3)
Sales ............................................... (14) (1) (15)
Transfer into Level 2 ................................. (107) — (107)
Balance at July 28, 2012 ............................... $— $ 1 $ 1
107