Cisco 2012 Annual Report Download - page 75
Download and view the complete annual report
Please find page 75 of the 2012 Cisco annual report below. You can navigate through the pages in the report by either clicking on the pages listed below, or by using the keyword search tool below to find specific information within the annual report.-
 1
1 -
2
-
3
-
4
-
5
-
6
-
7
-
8
-
9
-
10
-
11
-
12
-
13
-
14
-
15
-
16
-
17
-
18
-
19
-
20
-
21
-
22
-
23
-
24
-
25
-
26
-
27
-
28
-
29
-
30
-
31
-
32
-
33
-
34
-
35
-
36
-
37
-
38
-
39
-
40
-
41
-
42
-
43
-
44
-
45
-
46
-
47
-
48
-
49
-
50
-
51
-
52
-
53
-
54
-
55
-
56
-
57
-
58
-
59
-
60
-
61
-
62
-
63
-
64
-
 65
65 -
 66
66 -
 67
67 -
 68
68 -
 69
69 -
 70
70 -
 71
71 -
 72
72 -
 73
73 -
 74
74 -
 75
75 -
 76
76 -
 77
77 -
 78
78 -
 79
79 -
 80
80 -
 81
81 -
 82
82 -
 83
83 -
 84
84 -
 85
85 -
86
-
87
-
88
-
89
-
90
-
91
-
92
-
93
-
94
-
95
-
96
-
97
-
98
-
99
-
100
-
101
-
102
-
103
-
104
-
105
-
106
-
107
-
108
-
109
-
110
-
111
-
112
-
113
-
114
-
115
-
116
-
117
-
118
-
119
-
120
-
121
-
122
-
123
-
124
-
125
-
126
-
127
-
128
-
129
-
130
-
131
-
132
-
133
-
134
-
135
-
136
-
137
-
138
-
139
-
140
-
141
-
142
-
143
-
144
-
145
-
146
-
147
-
148
-
149
-
150
-
151
-
152
 |
 |

LIQUIDITY AND CAPITAL RESOURCES
The following sections discuss the effects of changes in our balance sheet, contractual obligations, other
commitments, and the stock repurchase program on our liquidity and capital resources.
Balance Sheet and Cash Flows
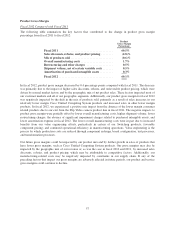
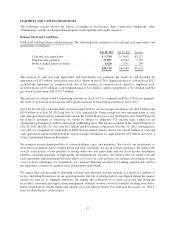
Cash and Cash Equivalents and Investments The following table summarizes our cash and cash equivalents and
investments (in millions):
July 28, 2012 July 30, 2011 Increase
Cash and cash equivalents ...................... $ 9,799 $ 7,662 $2,137
Fixed income securities ........................ 37,297 35,562 1,735
Publicly traded equity securities ................. 1,620 1,361 259
Total .................................. $48,716 $44,585 $4,131
The increase in cash and cash equivalents and investments was primarily the result of cash provided by
operations of $11.5 billion, an increase from $10.1 billion in fiscal 2011. Significant uses of cash in fiscal 2012
included the repurchase of common stock (net of the issuance of common stock related to employee stock
incentive plans) of $3.4 billion, cash dividends paid of $1.5 billion, capital expenditures of $1.1 billion, and the
pay-down of short-term debt of $557 million.
The increase in cash provided by operating activities in fiscal 2012 as compared with fiscal 2011 was primarily
the result of an increase in net income and a smaller increase in financing receivables in fiscal 2012.
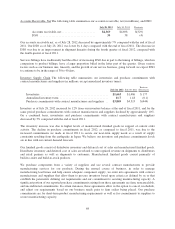
Our total in cash and cash equivalents and investments held by various foreign subsidiaries was $42.5 billion and
$39.8 billion as of July 28, 2012 and July 30, 2011, respectively. Under current tax laws and regulations, if cash
and cash equivalents and investments held outside the United States were to be distributed to the United States in
the form of dividends or otherwise, we would be subject to additional U.S. income taxes (subject to an
adjustment for foreign tax credits) and foreign withholding taxes. The balance available in the United States as of
July 28, 2012 and July 30, 2011 was $6.2 billion and $4.8 billion, respectively. On July 30, 2012, subsequent to
year end, we completed our acquisition of NDS Group Limited, which reduced our current balance of cash and
cash equivalents and investments held by various foreign subsidiaries by approximately $5.0 billion. See Note 3
to the Consolidated Financial Statements.
We maintain an investment portfolio of various holdings, types, and maturities. We classify our investments as
short-term investments based on their nature and their availability for use in current operations. We believe the
overall credit quality of our portfolio is strong, with our cash equivalents and our fixed income investment
portfolio consisting primarily of high quality investment-grade securities. We believe that our strong cash and
cash equivalents and investments position allows us to use our cash resources for strategic investments to gain
access to new technologies, for acquisitions, for customer financing activities, for working capital needs, and for
the repurchase of shares of common stock and payment of dividends.
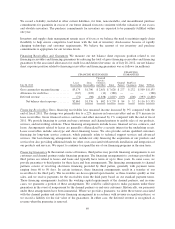
We expect that cash provided by operating activities may fluctuate in future periods as a result of a number of
factors, including fluctuations in our operating results, the rate at which products are shipped during the quarter
(which we refer to as shipment linearity), the timing and collection of accounts receivable and financing
receivables, inventory and supply chain management, deferred revenue, excess tax benefits resulting from share-
based compensation, and the timing and amount of tax and other payments. For additional discussion, see “Part I,
Item 1A. Risk Factors” in this report.
67