Cisco 2012 Annual Report Download - page 72
Download and view the complete annual report
Please find page 72 of the 2012 Cisco annual report below. You can navigate through the pages in the report by either clicking on the pages listed below, or by using the keyword search tool below to find specific information within the annual report.-
 1
1 -
2
-
3
-
4
-
5
-
6
-
7
-
8
-
9
-
10
-
11
-
12
-
13
-
14
-
15
-
16
-
17
-
18
-
19
-
20
-
21
-
22
-
23
-
24
-
25
-
26
-
27
-
28
-
29
-
30
-
31
-
32
-
33
-
34
-
35
-
36
-
37
-
38
-
39
-
40
-
41
-
42
-
43
-
44
-
45
-
46
-
47
-
48
-
49
-
50
-
51
-
52
-
53
-
54
-
55
-
56
-
57
-
58
-
59
-
60
-
61
-
 62
62 -
 63
63 -
 64
64 -
 65
65 -
 66
66 -
 67
67 -
 68
68 -
 69
69 -
 70
70 -
 71
71 -
 72
72 -
 73
73 -
 74
74 -
 75
75 -
 76
76 -
 77
77 -
 78
78 -
 79
79 -
 80
80 -
 81
81 -
 82
82 -
83
-
84
-
85
-
86
-
87
-
88
-
89
-
90
-
91
-
92
-
93
-
94
-
95
-
96
-
97
-
98
-
99
-
100
-
101
-
102
-
103
-
104
-
105
-
106
-
107
-
108
-
109
-
110
-
111
-
112
-
113
-
114
-
115
-
116
-
117
-
118
-
119
-
120
-
121
-
122
-
123
-
124
-
125
-
126
-
127
-
128
-
129
-
130
-
131
-
132
-
133
-
134
-
135
-
136
-
137
-
138
-
139
-
140
-
141
-
142
-
143
-
144
-
145
-
146
-
147
-
148
-
149
-
150
-
151
-
152
 |
 |

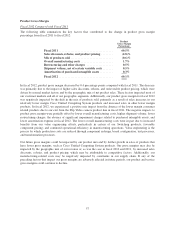
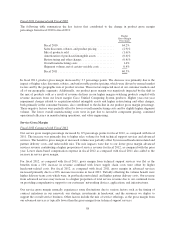
compared with fiscal 2010, the increase in the amortization of purchased intangible assets was due to impairment
charges included in operating expenses of $92 million, partially offset by lower amortization due to certain
purchased intangible assets having become fully amortized. The impairment charges in fiscal 2011 were
primarily due to declines in estimated fair value as a result of reductions in expected future cash flows associated
with certain of our consumer products. For additional information regarding purchased intangible assets, see
Note 4 to the Consolidated Financial Statements.
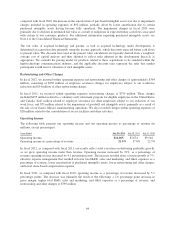
The fair value of acquired technology and patents, as well as acquired technology under development, is
determined at acquisition date primarily using the income approach, which discounts expected future cash flows
to present value. The discount rates used in the present value calculations are typically derived from a weighted-
average cost of capital analysis and then adjusted to reflect risks inherent in the development lifecycle as
appropriate. We consider the pricing model for products related to these acquisitions to be standard within the
high-technology communications industry, and the applicable discount rates represent the rates that market
participants would use for valuation of such intangible assets.
Restructuring and Other Charges
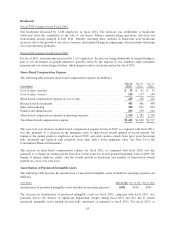
In fiscal 2012, we incurred within operating expenses net restructuring and other charges of approximately $304
million, consisting of $250 million of employee severance charges for employees subject to our workforce
reduction and $54 million of other restructuring charges.
In fiscal 2011, we incurred within operating expenses restructuring charges of $799 million. These charges
included $453 million related to a voluntary early retirement program for eligible employees in the United States
and Canada; $247 million related to employee severance for other employees subject to our reduction of our
work force; and $71 million related to the impairment of goodwill and intangible assets, primarily as a result of
the sale of our Juarez, Mexico manufacturing operations. We also recorded charges within operating expenses of
$28 million related to the consolidation of excess facilities and other activities.
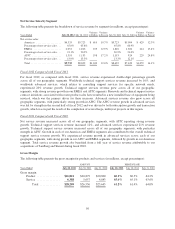
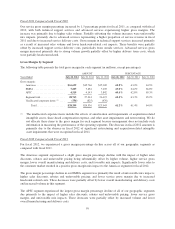
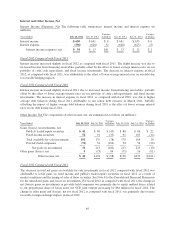
Operating Income
The following table presents our operating income and our operating income as percentage of revenue (in
millions, except percentages):
Years Ended July 28, 2012 July 30, 2011 July 31, 2010
Operating income .............................................. $10,065 $7,674 $9,164
Operating income as a percentage of revenue ........................ 21.9% 17.8% 22.9%
In fiscal 2012, as compared with fiscal 2011, our results reflect solid execution on delivering profitable growth,
as we grew operating income faster than revenue. Operating income increased by 31%, as a percentage of
revenue operating income increased by 4.1 percentage points. The increase resulted from: revenue growth of 7%;
effective expense management that resulted in lower total R&D, sales and marketing, and G&A expenses as a
percentage of revenue; lower amortization of purchased intangible assets; lower restructuring and other charges;
and lower share-based compensation expense.
In fiscal 2011, as compared with fiscal 2010, operating income as a percentage of revenue decreased by 5.1
percentage points. The decrease was primarily the result of the following: a 2.6 percentage point decrease in
gross margin; higher total R&D, sales and marketing, and G&A expenses as a percentage of revenue; and
restructuring and other charges of $799 million.
64