Cisco 2012 Annual Report Download - page 130
Download and view the complete annual report
Please find page 130 of the 2012 Cisco annual report below. You can navigate through the pages in the report by either clicking on the pages listed below, or by using the keyword search tool below to find specific information within the annual report.-
 1
1 -
2
-
3
-
4
-
5
-
6
-
7
-
8
-
9
-
10
-
11
-
12
-
13
-
14
-
15
-
16
-
17
-
18
-
19
-
20
-
21
-
22
-
23
-
24
-
25
-
26
-
27
-
28
-
29
-
30
-
31
-
32
-
33
-
34
-
35
-
36
-
37
-
38
-
39
-
40
-
41
-
42
-
43
-
44
-
45
-
46
-
47
-
48
-
49
-
50
-
51
-
52
-
53
-
54
-
55
-
56
-
57
-
58
-
59
-
60
-
61
-
62
-
63
-
64
-
65
-
66
-
67
-
68
-
69
-
70
-
71
-
72
-
73
-
74
-
75
-
76
-
77
-
78
-
79
-
80
-
81
-
82
-
83
-
84
-
85
-
86
-
87
-
88
-
89
-
90
-
91
-
92
-
93
-
94
-
95
-
96
-
97
-
98
-
99
-
100
-
101
-
102
-
103
-
104
-
105
-
106
-
107
-
108
-
109
-
110
-
111
-
112
-
113
-
114
-
115
-
116
-
117
-
118
-
119
-
 120
120 -
 121
121 -
 122
122 -
 123
123 -
 124
124 -
 125
125 -
 126
126 -
 127
127 -
 128
128 -
 129
129 -
 130
130 -
 131
131 -
 132
132 -
 133
133 -
 134
134 -
 135
135 -
 136
136 -
 137
137 -
 138
138 -
 139
139 -
 140
140 -
141
-
142
-
143
-
144
-
145
-
146
-
147
-
148
-
149
-
150
-
151
-
152
 |
 |

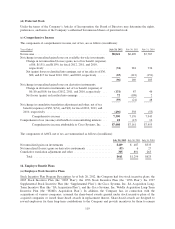
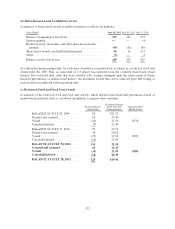
(d) Share-Based Awards Available for Grant
A summary of share-based awards available for grant is as follows (in millions):
Years Ended July 28, 2012 July 30, 2011 July 31, 2010
Balance at beginning of fiscal year .......................... 255 295 253
Options granted ......................................... —— (4)
Restricted stock, stock units, and other share-based awards
granted .............................................. (95) (82) (81)
Share-based awards canceled/forfeited/expired ................. 64 42 123
Other ................................................. (6) —4
Balance at end of fiscal year ............................... 218 255 295
As reflected in the preceding table, for each share awarded as restricted stock or subject to a restricted stock unit
award under the 2005 Plan, an equivalent of 1.5 shares was deducted from the available share-based award
balance. For restricted stock units that were awarded with vesting contingent upon the achievement of future
financial performance or market-based metrics, the maximum awards that can be achieved upon full vesting of
such awards were reflected in the preceding table.
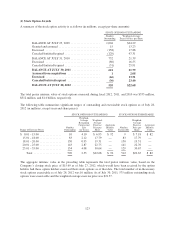
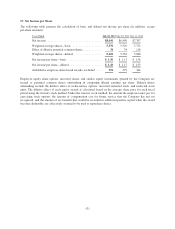
(e) Restricted Stock and Stock Unit Awards
A summary of the restricted stock and stock unit activity, which includes time-based and performance-based or
market-based restricted stock, is as follows (in millions, except per-share amounts):
Restricted Stock/
Stock Units
Weighted-Average
Grant Date Fair
Value per Share
Aggregated Fair
Market Value
BALANCE AT JULY 25, 2009 ....... 62 $21.25
Granted and assumed ............... 54 23.40
Vested ........................... (16) 21.56 $378
Canceled/forfeited .................. (3) 22.40
BALANCE AT JULY 31, 2010 ....... 97 22.35
Granted and assumed ............... 56 20.62
Vested ........................... (27) 22.54 $529
Canceled/forfeited .................. (10) 22.04
BALANCE AT JULY 30, 2011 ...... 116 21.50
Granted and assumed .............. 65 17.45
Vested ........................... (35) 21.94 $580
Canceled/forfeited ................. (18) 20.38
BALANCE AT JULY 28, 2012 ...... 128 $19.46
122