BMW 2012 Annual Report Download - page 83
Download and view the complete annual report
Please find page 83 of the 2012 BMW annual report below. You can navigate through the pages in the report by either clicking on the pages listed below, or by using the keyword search tool below to find specific information within the annual report.-
 1
1 -
2
-
3
-
4
-
5
-
6
-
7
-
8
-
9
-
10
-
11
-
12
-
13
-
14
-
15
-
16
-
17
-
18
-
19
-
20
-
21
-
22
-
23
-
24
-
25
-
26
-
27
-
28
-
29
-
30
-
31
-
32
-
33
-
34
-
35
-
36
-
37
-
38
-
39
-
40
-
41
-
42
-
43
-
44
-
45
-
46
-
47
-
48
-
49
-
50
-
51
-
52
-
53
-
54
-
55
-
56
-
57
-
58
-
59
-
60
-
61
-
62
-
63
-
64
-
65
-
66
-
67
-
68
-
69
-
70
-
71
-
72
-
 73
73 -
 74
74 -
 75
75 -
 76
76 -
 77
77 -
 78
78 -
 79
79 -
 80
80 -
 81
81 -
 82
82 -
 83
83 -
 84
84 -
 85
85 -
 86
86 -
 87
87 -
 88
88 -
 89
89 -
 90
90 -
 91
91 -
 92
92 -
 93
93 -
94
-
95
-
96
-
97
-
98
-
99
-
100
-
101
-
102
-
103
-
104
-
105
-
106
-
107
-
108
-
109
-
110
-
111
-
112
-
113
-
114
-
115
-
116
-
117
-
118
-
119
-
120
-
121
-
122
-
123
-
124
-
125
-
126
-
127
-
128
-
129
-
130
-
131
-
132
-
133
-
134
-
135
-
136
-
137
-
138
-
139
-
140
-
141
-
142
-
143
-
144
-
145
-
146
-
147
-
148
-
149
-
150
-
151
-
152
-
153
-
154
-
155
-
156
-
157
-
158
-
159
-
160
-
161
-
162
-
163
-
164
-
165
-
166
-
167
-
168
-
169
-
170
-
171
-
172
-
173
-
174
-
175
-
176
-
177
-
178
-
179
-
180
-
181
-
182
-
183
-
184
-
185
-
186
-
187
-
188
-
189
-
190
-
191
-
192
-
193
-
194
-
195
-
196
-
197
-
198
-
199
-
200
-
201
-
202
-
203
-
204
-
205
-
206
-
207
-
208
-
209
-
210
-
211
-
212
-
213
-
214
-
215
-
216
-
217
-
218
-
219
-
220
-
221
-
222
-
223
-
224
-
225
-
226
-
227
-
228
-
229
-
230
-
231
-
232
-
233
-
234
-
235
-
236
-
237
-
238
-
239
-
240
-
241
-
242
-
243
-
244
-
245
-
246
-
247
-
248
-
249
-
250
-
251
-
252
-
253
-
254
-
255
-
256
-
257
-
258
-
259
-
260
-
261
-
262
-
263
-
264
-
265
-
266
-
267
-
268
-
269
-
270
-
271
-
272
-
273
-
274
-
275
-
276
-
277
-
278
-
279
-
280
-
281
-
282
-
283
-
284
 |
 |

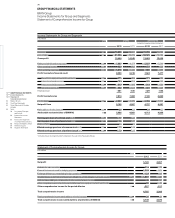
83 GROUP FINANCIAL STATEMENTS
Automotive Financial Services
(unaudited supplementary information) (unaudited supplementary information)
2012 20111 2012 20111
(changed) (changed)
4,737 4,991 1,016 737 Net profit
Reconciliation between net profit and cash inflow / outflow from operating activities
3,026 2,726 – 104 86 Current tax
104 95 –2 102 Other interest and similar income / expenses
3,679 3,564 38 20 Depreciation and amortisation of other tangible, intangible and investment assets
261 577 – 2 – 156 Change in provisions
23 29 – 2,256 – 1,311 Change in leased products
– – – 3,988 – 2,837 Change in receivables from sales financing
– 386 – 707 497 804 Change in deferred taxes
265 – 79 – 13 – 9 Other non-cash income and expense items
– 14 – – 2 1 Gain / loss on disposal of tangible and intangible assets and marketable securities
– 271 – 164 – – Result from equity accounted investments
1,622 – 1,590 18 83
– 54 – 1,685 – – 2 Change in inventories
722 – 886 19 101 Change in trade receivables
954 981 – 1 – 16 Change in trade payables
– 1,937 887 743 846 Change in other operating assets and liabilities
– 2,191 – 2,453 – 139 – 171 Income taxes paid
249 234 –2 –2 Interest received
9,167 8,110 – 4,192 – 1,897 Cash inflow / outflow from operating activities
– 5,074 – 3,565 – 37 – 25 Investment in intangible assets and property, plant and equipment
35 50 7 6 Proceeds from the disposal of intangible assets and property, plant and equipment
– 384 – 1,201 – – Expenditure for investments
– – 249 – 104 Net cash in acquiring ICL Group
65 21 – – Proceeds from the disposal of investments
– 1,167 – 1,866 – 97 – 113 Cash payments for the purchase of marketable securities
995 1,085 95 232 Cash proceeds from the sale of marketable securities
– 5,530 – 5,725 – 32 204 Cash inflow / outflow from investing activities
– – – – Issue / Buy-back of treasury shares
19 16 – – Payments into equity
– 1,516 – 852 – – Payment of dividend for the previous year
– 833 – 1,666 1,505 – 1,021 Intragroup financing and equity transactions
– 157 – 244 –2 –2 Interest paid
– – 1,189 653 Proceeds from the issue of bonds
– – – 842 – 925 Repayment of bonds
508 316 1,653 3,229 Change in other financial liabilities
– 4 299 – – Change in commercial paper
– 1,983 – 2,131 3,505 1,936 Cash inflow / outflow from financing activities
– 11 – 10 – 3 – 6 Effect of exchange rate on cash and cash equivalents
12 – 1 54 Effect of changes in composition of Group on cash and cash equivalents
1,655 244 – 721 291 Change in cash and cash equivalents
5,829 5,585 1,518 1,227 Cash and cash equivalents as at 1 January
7,484 5,829 797 1,518 Cash and cash equivalents as at 31 December