BMW 2012 Annual Report Download - page 139
Download and view the complete annual report
Please find page 139 of the 2012 BMW annual report below. You can navigate through the pages in the report by either clicking on the pages listed below, or by using the keyword search tool below to find specific information within the annual report.-
 1
1 -
2
-
3
-
4
-
5
-
6
-
7
-
8
-
9
-
10
-
11
-
12
-
13
-
14
-
15
-
16
-
17
-
18
-
19
-
20
-
21
-
22
-
23
-
24
-
25
-
26
-
27
-
28
-
29
-
30
-
31
-
32
-
33
-
34
-
35
-
36
-
37
-
38
-
39
-
40
-
41
-
42
-
43
-
44
-
45
-
46
-
47
-
48
-
49
-
50
-
51
-
52
-
53
-
54
-
55
-
56
-
57
-
58
-
59
-
60
-
61
-
62
-
63
-
64
-
65
-
66
-
67
-
68
-
69
-
70
-
71
-
72
-
73
-
74
-
75
-
76
-
77
-
78
-
79
-
80
-
81
-
82
-
83
-
84
-
85
-
86
-
87
-
88
-
89
-
90
-
91
-
92
-
93
-
94
-
95
-
96
-
97
-
98
-
99
-
100
-
101
-
102
-
103
-
104
-
105
-
106
-
107
-
108
-
109
-
110
-
111
-
112
-
113
-
114
-
115
-
116
-
117
-
118
-
119
-
120
-
121
-
122
-
123
-
124
-
125
-
126
-
127
-
128
-
 129
129 -
 130
130 -
 131
131 -
 132
132 -
 133
133 -
 134
134 -
 135
135 -
 136
136 -
 137
137 -
 138
138 -
 139
139 -
 140
140 -
 141
141 -
 142
142 -
 143
143 -
 144
144 -
 145
145 -
 146
146 -
 147
147 -
 148
148 -
 149
149 -
150
-
151
-
152
-
153
-
154
-
155
-
156
-
157
-
158
-
159
-
160
-
161
-
162
-
163
-
164
-
165
-
166
-
167
-
168
-
169
-
170
-
171
-
172
-
173
-
174
-
175
-
176
-
177
-
178
-
179
-
180
-
181
-
182
-
183
-
184
-
185
-
186
-
187
-
188
-
189
-
190
-
191
-
192
-
193
-
194
-
195
-
196
-
197
-
198
-
199
-
200
-
201
-
202
-
203
-
204
-
205
-
206
-
207
-
208
-
209
-
210
-
211
-
212
-
213
-
214
-
215
-
216
-
217
-
218
-
219
-
220
-
221
-
222
-
223
-
224
-
225
-
226
-
227
-
228
-
229
-
230
-
231
-
232
-
233
-
234
-
235
-
236
-
237
-
238
-
239
-
240
-
241
-
242
-
243
-
244
-
245
-
246
-
247
-
248
-
249
-
250
-
251
-
252
-
253
-
254
-
255
-
256
-
257
-
258
-
259
-
260
-
261
-
262
-
263
-
264
-
265
-
266
-
267
-
268
-
269
-
270
-
271
-
272
-
273
-
274
-
275
-
276
-
277
-
278
-
279
-
280
-
281
-
282
-
283
-
284
 |
 |

139 GROUP FINANCIAL STATEMENTS
in € million 31. 12. 2012 31. 12. 2011
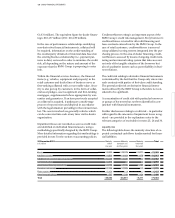
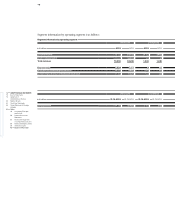
Euro / Chinese Renminbi 246 180
Euro / US Dollar 163 121
Euro / British Pound 65 182
Euro / Japanese Yen 15 23
Euro / Russian Rouble 69 97
in € million 31. 12. 2012 31. 12. 2011
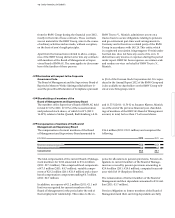
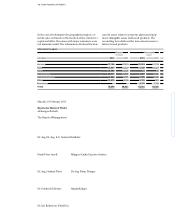
Euro 12,736 6,066
US Dollar 10,489 8,684
British Pound 3,814 3,278
In the next stage, these exposures are compared to all
hedges that are in place. The net cash flow surplus
represents an uncovered risk position. The cash-flow-at-
risk approach involves allocating the impact of poten-
tial exchange rate fluctuations to operating cash flows
on the basis of probability distributions. Volatilities
and correlations serve as input factors to assess the rele-
vant probability distributions.
The potential negative impact on earnings is computed
for each currency for the following financial year on
the basis of current market prices and exposures to a
Currency risk for the BMW Group is concentrated on
the
currencies referred to above.
Interest rate risk
The BMW Group’s financial management system in-
volves
the use of standard financial instruments such as
short-term deposits, investments in variable and fixed-
income securities as well as securities funds. The BMW
Group is therefore exposed to risks resulting from
changes in interest rates.
confidence level of 95 % and a holding period of up to
one year. Correlations between the various currencies
are taken into account when the risks are aggregated,
thus reducing the overall risk.
The following table shows the potential negative impact
for the BMW Group – measured on the basis of the cash-
flow-at-risk approach – attributable to unfavourable
changes in exchange rates. The impact for the principal
currencies, in each case for the following financial year,
is as follows:
These risks arise when funds with differing fixed-rate
periods or differing terms are borrowed and invested.
All items subject to, or bearing, interest are exposed to
interest rate risk. Interest rate risks can affect either side
of the balance sheet.
The fair values of the Group’s interest rate portfolios for
the three principal currencies were as follows at the end
of the reporting period:
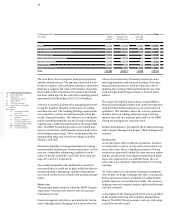
The starting point for analysing currency risk with this
model is the identification of forecast foreign currency
transactions or “exposures”. At the end of the reporting
period, the principal exposures for the relevant coming
year were as follows:
in € million 31. 12. 2012 31. 12. 2011
Euro / Chinese Renminbi 8,429 7,114
Euro / US Dollar 5,311 4,281
Euro / British Pound 3,206 3,266
Euro / Japanese Yen 1,585 1,334
Euro / Russian Rouble 1,638 1,330