BMW 2012 Annual Report Download - page 140
Download and view the complete annual report
Please find page 140 of the 2012 BMW annual report below. You can navigate through the pages in the report by either clicking on the pages listed below, or by using the keyword search tool below to find specific information within the annual report.-
 1
1 -
2
-
3
-
4
-
5
-
6
-
7
-
8
-
9
-
10
-
11
-
12
-
13
-
14
-
15
-
16
-
17
-
18
-
19
-
20
-
21
-
22
-
23
-
24
-
25
-
26
-
27
-
28
-
29
-
30
-
31
-
32
-
33
-
34
-
35
-
36
-
37
-
38
-
39
-
40
-
41
-
42
-
43
-
44
-
45
-
46
-
47
-
48
-
49
-
50
-
51
-
52
-
53
-
54
-
55
-
56
-
57
-
58
-
59
-
60
-
61
-
62
-
63
-
64
-
65
-
66
-
67
-
68
-
69
-
70
-
71
-
72
-
73
-
74
-
75
-
76
-
77
-
78
-
79
-
80
-
81
-
82
-
83
-
84
-
85
-
86
-
87
-
88
-
89
-
90
-
91
-
92
-
93
-
94
-
95
-
96
-
97
-
98
-
99
-
100
-
101
-
102
-
103
-
104
-
105
-
106
-
107
-
108
-
109
-
110
-
111
-
112
-
113
-
114
-
115
-
116
-
117
-
118
-
119
-
120
-
121
-
122
-
123
-
124
-
125
-
126
-
127
-
128
-
129
-
 130
130 -
 131
131 -
 132
132 -
 133
133 -
 134
134 -
 135
135 -
 136
136 -
 137
137 -
 138
138 -
 139
139 -
 140
140 -
 141
141 -
 142
142 -
 143
143 -
 144
144 -
 145
145 -
 146
146 -
 147
147 -
 148
148 -
 149
149 -
 150
150 -
151
-
152
-
153
-
154
-
155
-
156
-
157
-
158
-
159
-
160
-
161
-
162
-
163
-
164
-
165
-
166
-
167
-
168
-
169
-
170
-
171
-
172
-
173
-
174
-
175
-
176
-
177
-
178
-
179
-
180
-
181
-
182
-
183
-
184
-
185
-
186
-
187
-
188
-
189
-
190
-
191
-
192
-
193
-
194
-
195
-
196
-
197
-
198
-
199
-
200
-
201
-
202
-
203
-
204
-
205
-
206
-
207
-
208
-
209
-
210
-
211
-
212
-
213
-
214
-
215
-
216
-
217
-
218
-
219
-
220
-
221
-
222
-
223
-
224
-
225
-
226
-
227
-
228
-
229
-
230
-
231
-
232
-
233
-
234
-
235
-
236
-
237
-
238
-
239
-
240
-
241
-
242
-
243
-
244
-
245
-
246
-
247
-
248
-
249
-
250
-
251
-
252
-
253
-
254
-
255
-
256
-
257
-
258
-
259
-
260
-
261
-
262
-
263
-
264
-
265
-
266
-
267
-
268
-
269
-
270
-
271
-
272
-
273
-
274
-
275
-
276
-
277
-
278
-
279
-
280
-
281
-
282
-
283
-
284
 |
 |

140
78 GROUP FINANCIAL STATEMENTS
78 Income Statements
78 Statement of
Comprehensive Income
80 Balance Sheets
82 Cash Flow Statements
84 Group Statement of Changes
in Equity
86 Notes
86 Accounting Principles
and Policies
100 Notes to the Income
Statement
107 Notes to the Statement
of Comprehensive Income
108
Notes to the Balance Sheet
129 Other Disclosures
145 Segment Information
In the next stage, these exposures are compared to all
hedges that are in place. The net cash flow amount
represents an uncovered risk position. The cash-flow-at-
risk approach now applied – which should generate
a more accurate picture than the sensitivity analysis
approach previously used – involves allocating the im-
pact of potential fluctuations in raw materials prices
to operating cash flows on the basis of probability distri-
butions. Volatilities and correlations serve as input fac-
tors to assess the relevant probability distributions.
The potential negative impact on earnings is computed
for each raw material category for the following financial
Raw materials price risk
The BMW Group is exposed to the risk of price fluctua-
tions for raw materials. A description of the manage-
ment of these risks is provided in the Combined Group
and Company Management Report.
Interest rate risks can be managed by the use of interest
rate derivatives. The interest rate contracts used for
hedging purposes comprise mainly swaps which are
accounted for on the basis of whether they are desig-
nated
as a fair value hedge or as a cash flow hedge.
A description of the management of interest risk is
provided in the Combined Group and Company
Management Report.
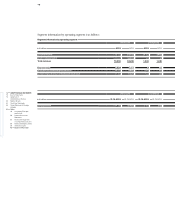
As stated there, the BMW Group applies a group-wide
value-at-risk approach for internal reporting purposes
and to manage interest rate risks. This is based on a
state-of-the-art historical simulation, in which the po-
tential future fair value losses of the interest rate port-
folios are compared across the Group with expected
amounts measured on the basis of a holding period of
250 days and a confidence level of 99.98 %. Aggregation
of these results creates a risk reduction effect due to
correlations between the various portfolios. The meth-
odology applied was refined during the year under
report, primarily in order to take account of new regula-
tory requirements.
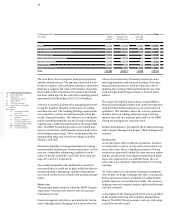
In the following table the potential volumes of fair value
fluctuations – measured on the basis of the value-at-risk
approach – are compared with the expected value for
the interest rate relevant positions of the BMW Group
for
the three principal currencies:
year on the basis of current market prices and expo-
sure to a confidence level of 95 % and a holding period
of up to one year. Correlations between the various
categories of raw materials are taken into account
when the risks are aggregated, thus reducing the over-
all risk.
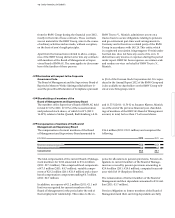
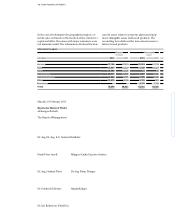
The following table shows the potential negative impact
for the BMW Group – measured on the basis of the cash-
flow-at-risk approach – attributable to fluctuations in
prices across all categories of raw materials. The risk at
each reporting date for the following financial year was
as follows:
The first step in the analysis of the raw materials price
risk is to determine the volume of planned purchases
of raw materials (and components containing those raw
materials). These amounts, which represent the gross
exposure, were as follows at each reporting date for the
following financial year:
in € million 31. 12. 2012 31. 12. 2011
Euro 269 38
US Dollar 271 24
British Pound 44 3
in € million 31. 12. 2012 31. 12. 2011
Raw materials price exposures 3,370 3,300
in € million 31. 12. 2012 31. 12. 2011
Cash flow at risk 350 305