BMW 2012 Annual Report Download - page 5
Download and view the complete annual report
Please find page 5 of the 2012 BMW annual report below. You can navigate through the pages in the report by either clicking on the pages listed below, or by using the keyword search tool below to find specific information within the annual report.-
 1
1 -
 2
2 -
 3
3 -
 4
4 -
 5
5 -
 6
6 -
 7
7 -
 8
8 -
 9
9 -
 10
10 -
 11
11 -
 12
12 -
 13
13 -
 14
14 -
 15
15 -
 16
16 -
17
-
18
-
19
-
20
-
21
-
22
-
23
-
24
-
25
-
26
-
27
-
28
-
29
-
30
-
31
-
32
-
33
-
34
-
35
-
36
-
37
-
38
-
39
-
40
-
41
-
42
-
43
-
44
-
45
-
46
-
47
-
48
-
49
-
50
-
51
-
52
-
53
-
54
-
55
-
56
-
57
-
58
-
59
-
60
-
61
-
62
-
63
-
64
-
65
-
66
-
67
-
68
-
69
-
70
-
71
-
72
-
73
-
74
-
75
-
76
-
77
-
78
-
79
-
80
-
81
-
82
-
83
-
84
-
85
-
86
-
87
-
88
-
89
-
90
-
91
-
92
-
93
-
94
-
95
-
96
-
97
-
98
-
99
-
100
-
101
-
102
-
103
-
104
-
105
-
106
-
107
-
108
-
109
-
110
-
111
-
112
-
113
-
114
-
115
-
116
-
117
-
118
-
119
-
120
-
121
-
122
-
123
-
124
-
125
-
126
-
127
-
128
-
129
-
130
-
131
-
132
-
133
-
134
-
135
-
136
-
137
-
138
-
139
-
140
-
141
-
142
-
143
-
144
-
145
-
146
-
147
-
148
-
149
-
150
-
151
-
152
-
153
-
154
-
155
-
156
-
157
-
158
-
159
-
160
-
161
-
162
-
163
-
164
-
165
-
166
-
167
-
168
-
169
-
170
-
171
-
172
-
173
-
174
-
175
-
176
-
177
-
178
-
179
-
180
-
181
-
182
-
183
-
184
-
185
-
186
-
187
-
188
-
189
-
190
-
191
-
192
-
193
-
194
-
195
-
196
-
197
-
198
-
199
-
200
-
201
-
202
-
203
-
204
-
205
-
206
-
207
-
208
-
209
-
210
-
211
-
212
-
213
-
214
-
215
-
216
-
217
-
218
-
219
-
220
-
221
-
222
-
223
-
224
-
225
-
226
-
227
-
228
-
229
-
230
-
231
-
232
-
233
-
234
-
235
-
236
-
237
-
238
-
239
-
240
-
241
-
242
-
243
-
244
-
245
-
246
-
247
-
248
-
249
-
250
-
251
-
252
-
253
-
254
-
255
-
256
-
257
-
258
-
259
-
260
-
261
-
262
-
263
-
264
-
265
-
266
-
267
-
268
-
269
-
270
-
271
-
272
-
273
-
274
-
275
-
276
-
277
-
278
-
279
-
280
-
281
-
282
-
283
-
284
 |
 |

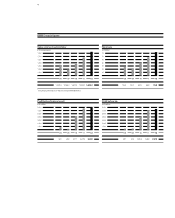
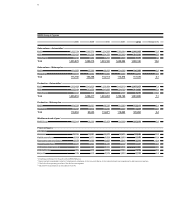
BMW Group in figures
2008 2009 2010 2011 2012 Change in %
Sales volume – Automobiles1
BMW 1,202,239 1,068,770 1,224,280 1,380,384 1,540,085 11.6
MINI 232,425 216,538 234,175 285,060 301,526 5.8
Rolls-Royce 1,212 1,002 2,711 3,538 3,575 1.0
Total 1,435,876 1,286,310 1,461,166 1,668,982 1,845,186 10.6
Sales volume – Motorcycles
BMW 101,685 87,306 98,047 104,286 106,358 2.0
Husqvarna 13,511 13,052 12,066 9,286 10,751 15.8
Total 115,196 100,358 110,113 113,572 117,109 3 . 1
Production – Automobiles1
BMW 1,203,482 1,043,829 1,236,989 1,440,315 1,547,057 7.4
MINI 235,019 213,670 241,043 294,120 311,490 5.9
Rolls-Royce 1,417 918 3,221 3,725 3,279 – 12.0
Total 1,439,918 1,258,417 1,481,253 1,738,160 1,861,826 7 . 1
Production – Motorcycles
BMW 104,220 82,631 99,236 110,360 113,811 3.1
Husqvarna 14,232 10,612 13,035 8,505 11,473 34.9
Total 118,452 93,243 112,271 118,865 125,284 5 . 4
Workforce at end of year2
BMW Group 100,041 96,230 95,453 100,306 105,876 5.6
Financial figures
in € million
Revenues 53,197 50,681 60,477 68,821 76,848 11.7
Capital expenditure 4,204 3,471 3,263 3,692 5,240 41.9
Depreciation and amortisation 3,670 3,600 3,682 3,646 3,541 – 2.9
Operating cash flow3 4,471 4,921 8,149 8,1104 9,167 13.0
Profit before financial result 921 289 5,111 8,018 8,300 3.5
Profit before tax 351 413 4,853 7,383 7,819 5.9
Net profit 330 210 3,243 4,907 5,122 4.4
1 Including automobiles from the joint venture BMW Brilliance.
2 Figures exclude suspended contracts of employment, employees in the non-work phases of pre-retirement part-time arrangements and low income earners.
3 Cash inflow from operating activities of the Automotive segment.
4 Adjusted for reclassifications as described in note 42.
5