BMW 2012 Annual Report Download - page 103
Download and view the complete annual report
Please find page 103 of the 2012 BMW annual report below. You can navigate through the pages in the report by either clicking on the pages listed below, or by using the keyword search tool below to find specific information within the annual report.-
 1
1 -
2
-
3
-
4
-
5
-
6
-
7
-
8
-
9
-
10
-
11
-
12
-
13
-
14
-
15
-
16
-
17
-
18
-
19
-
20
-
21
-
22
-
23
-
24
-
25
-
26
-
27
-
28
-
29
-
30
-
31
-
32
-
33
-
34
-
35
-
36
-
37
-
38
-
39
-
40
-
41
-
42
-
43
-
44
-
45
-
46
-
47
-
48
-
49
-
50
-
51
-
52
-
53
-
54
-
55
-
56
-
57
-
58
-
59
-
60
-
61
-
62
-
63
-
64
-
65
-
66
-
67
-
68
-
69
-
70
-
71
-
72
-
73
-
74
-
75
-
76
-
77
-
78
-
79
-
80
-
81
-
82
-
83
-
84
-
85
-
86
-
87
-
88
-
89
-
90
-
91
-
92
-
 93
93 -
 94
94 -
 95
95 -
 96
96 -
 97
97 -
 98
98 -
 99
99 -
 100
100 -
 101
101 -
 102
102 -
 103
103 -
 104
104 -
 105
105 -
 106
106 -
 107
107 -
 108
108 -
 109
109 -
 110
110 -
 111
111 -
 112
112 -
 113
113 -
114
-
115
-
116
-
117
-
118
-
119
-
120
-
121
-
122
-
123
-
124
-
125
-
126
-
127
-
128
-
129
-
130
-
131
-
132
-
133
-
134
-
135
-
136
-
137
-
138
-
139
-
140
-
141
-
142
-
143
-
144
-
145
-
146
-
147
-
148
-
149
-
150
-
151
-
152
-
153
-
154
-
155
-
156
-
157
-
158
-
159
-
160
-
161
-
162
-
163
-
164
-
165
-
166
-
167
-
168
-
169
-
170
-
171
-
172
-
173
-
174
-
175
-
176
-
177
-
178
-
179
-
180
-
181
-
182
-
183
-
184
-
185
-
186
-
187
-
188
-
189
-
190
-
191
-
192
-
193
-
194
-
195
-
196
-
197
-
198
-
199
-
200
-
201
-
202
-
203
-
204
-
205
-
206
-
207
-
208
-
209
-
210
-
211
-
212
-
213
-
214
-
215
-
216
-
217
-
218
-
219
-
220
-
221
-
222
-
223
-
224
-
225
-
226
-
227
-
228
-
229
-
230
-
231
-
232
-
233
-
234
-
235
-
236
-
237
-
238
-
239
-
240
-
241
-
242
-
243
-
244
-
245
-
246
-
247
-
248
-
249
-
250
-
251
-
252
-
253
-
254
-
255
-
256
-
257
-
258
-
259
-
260
-
261
-
262
-
263
-
264
-
265
-
266
-
267
-
268
-
269
-
270
-
271
-
272
-
273
-
274
-
275
-
276
-
277
-
278
-
279
-
280
-
281
-
282
-
283
-
284
 |
 |

103 GROUP FINANCIAL STATEMENTS
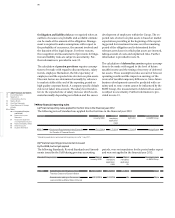
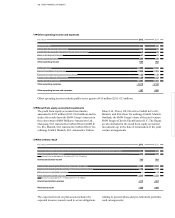
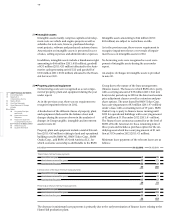
The difference between the expected and actual tax expense is explained in the following reconciliation:
Tax increases as a result of non-tax-deductible expenses
relate mainly to the impact of non-recoverable
with-
holding taxes on intragroup dividends and transfer price
issues. Decreases in taxes due to tax-exempt income
amounted to € 89 million (2011: € 104 million).
The net expense shown in the line “Tax expense / benefits
for prior periods” relates primarily to appropriate
pro-
vision recognised for tax field audit issues and is lower
than the net expense reported in the previous year.
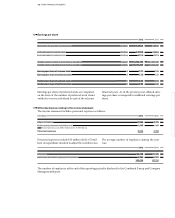
Deferred tax assets on tax loss carryforwards and capi-
tal losses before allowances totalled € 923 million (2011:
€ 1,452 million). After valuation allowances of € 492 mil-
lion (2011: € 509 million), their carrying amount stood at
€ 431 million (2011: € 943 million).
The line “Other variances” comprises primarily recon-
ciling items relating to the Group’s share of results of
equity accounted investments.
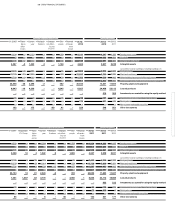
The allocation of deferred taxes tax assets and liabilities
to balance sheet line items at 31 December is shown in
the following table:
Tax losses available for carryforward – for the most part
usable without restriction – decreased to € 1.3 billion
(2011: € 2.6 billion). This includes an amount of € 92
mil-
lion (2011: € 58 million), for which a valuation allowance
of € 27 million (2011: € 17 million) was recognised on the
Deferred tax assets Deferred tax liabilities
in € million 2012 2011 2012 2011
Intangible assets 5 2 1,356 1,341
Property, plant and equipment 37 44 260 273
Leased products 441 476 5,837 5,794
Investments 11 6 11 1
Other assets 1,067 1,098 3,497 3,186
Tax loss carryforwards 923 1,452 – –
Provisions 3,253 2,601 60 46
Liabilities 2,984 2,714 350 389
Eliminations 2,729 2,389 626 590
11,450 10,782 11,997 11,620
Valuation allowance – 492 – 509 – –
Netting – 8,957 – 8,347 – 8,957 – 8,347
Deferred taxes 2,001 1,926 3,040 3,273
Net 1,039 1,347
in € million 2012 2011
Profit before tax 7,819 7,383
Tax rate applicable in Germany 30.5 % 30.5 %
Expected tax expense 2,385 2,252
Variances due to different tax rates – 56 – 70
Tax increases (+) / tax reductions (–) as a result of non-taxable income and non-deductible expenses 302 59
Tax expense (+) / benefits (–) for prior periods 128 201
Other variances – 62 34
Actual tax expense 2,697 2,476
Effective tax rate 34.5 % 33.5 %