BMW 2012 Annual Report Download - page 51
Download and view the complete annual report
Please find page 51 of the 2012 BMW annual report below. You can navigate through the pages in the report by either clicking on the pages listed below, or by using the keyword search tool below to find specific information within the annual report.-
 1
1 -
2
-
3
-
4
-
5
-
6
-
7
-
8
-
9
-
10
-
11
-
12
-
13
-
14
-
15
-
16
-
17
-
18
-
19
-
20
-
21
-
22
-
23
-
24
-
25
-
26
-
27
-
28
-
29
-
30
-
31
-
32
-
33
-
34
-
35
-
36
-
37
-
38
-
39
-
40
-
 41
41 -
 42
42 -
 43
43 -
 44
44 -
 45
45 -
 46
46 -
 47
47 -
 48
48 -
 49
49 -
 50
50 -
 51
51 -
 52
52 -
 53
53 -
 54
54 -
 55
55 -
 56
56 -
 57
57 -
 58
58 -
 59
59 -
 60
60 -
 61
61 -
62
-
63
-
64
-
65
-
66
-
67
-
68
-
69
-
70
-
71
-
72
-
73
-
74
-
75
-
76
-
77
-
78
-
79
-
80
-
81
-
82
-
83
-
84
-
85
-
86
-
87
-
88
-
89
-
90
-
91
-
92
-
93
-
94
-
95
-
96
-
97
-
98
-
99
-
100
-
101
-
102
-
103
-
104
-
105
-
106
-
107
-
108
-
109
-
110
-
111
-
112
-
113
-
114
-
115
-
116
-
117
-
118
-
119
-
120
-
121
-
122
-
123
-
124
-
125
-
126
-
127
-
128
-
129
-
130
-
131
-
132
-
133
-
134
-
135
-
136
-
137
-
138
-
139
-
140
-
141
-
142
-
143
-
144
-
145
-
146
-
147
-
148
-
149
-
150
-
151
-
152
-
153
-
154
-
155
-
156
-
157
-
158
-
159
-
160
-
161
-
162
-
163
-
164
-
165
-
166
-
167
-
168
-
169
-
170
-
171
-
172
-
173
-
174
-
175
-
176
-
177
-
178
-
179
-
180
-
181
-
182
-
183
-
184
-
185
-
186
-
187
-
188
-
189
-
190
-
191
-
192
-
193
-
194
-
195
-
196
-
197
-
198
-
199
-
200
-
201
-
202
-
203
-
204
-
205
-
206
-
207
-
208
-
209
-
210
-
211
-
212
-
213
-
214
-
215
-
216
-
217
-
218
-
219
-
220
-
221
-
222
-
223
-
224
-
225
-
226
-
227
-
228
-
229
-
230
-
231
-
232
-
233
-
234
-
235
-
236
-
237
-
238
-
239
-
240
-
241
-
242
-
243
-
244
-
245
-
246
-
247
-
248
-
249
-
250
-
251
-
252
-
253
-
254
-
255
-
256
-
257
-
258
-
259
-
260
-
261
-
262
-
263
-
264
-
265
-
266
-
267
-
268
-
269
-
270
-
271
-
272
-
273
-
274
-
275
-
276
-
277
-
278
-
279
-
280
-
281
-
282
-
283
-
284
 |
 |

51 COMBINED GROUP AND COMPANY MANAGEMENT REPORT
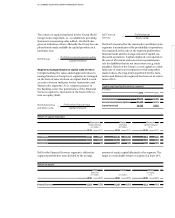
The return on capital employed for the Group (RoCE
Group) is also important, as – in addition to providing
the basis for measuring value added – the RoCE also
gives an indication of how efficiently the Group has em-
ployed funds made available by capital providers in a
particular year.
Profit before interest expense and tax
RoCE Group = Capital employed
Segments managed based on capital rates of return
Complementing the value added approach taken to
manage business at Group level, segments are managed
on the basis of rates of return on capital. RoCE is used
as a rate-of-return indicator for the Automotive and
Motorcycles segments. As is common practice in
the banking sector, the performance of the Financial
Services segment is measured on the basis of the re-
turn on equity (RoE).
RoCE Automotive Profit before financial result
and Motorcycles =
Capital employed
RoE for the Financial Services segment is defined as
segment profit before taxes divided by the average
amount of equity capital allocated to the segment. The
target is a sustainable return on equity of at least 18 %.
RoE Financial Profit before tax
Services = Equity capital
The RoCE measured for the Automotive and Motorcycles
segments is an indicator of the profitability of operations.
It is measured as the ratio of the segment profit before
financial result and the average amount of capital em-
ployed in operations. Capital employed corresponds to
the sum of all current and non-current operational as-
sets less liabilities that do not incur interest (e. g. trade
payables). Based on the Group’s cost of capital as a mini-
mum rate of return and
comparisons with competitive
market values, the long-term
target RoCE for the Auto-
motive and Motorcycles segments has been set at a mini-
mum of 26 %.
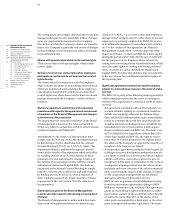
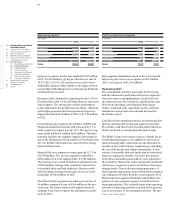
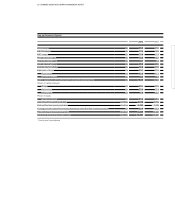
Capital employed by Automotive segment
in € million
2012 2011
Operational assets 31,613 29,323
less: non-interest-bearing liabilities 21,448 19,651
Capital employed 10,165 9,672
Return on equity
Profit Equity Return
before tax on equity
in € million in € million in %
2012 2011 2012 2011 2012 2011
Financial Services 1,561 1,790 7,347 6,084 21.2 29.4
Return on capital employed
Earnings for Capital Return on
RoCE purposes employed capital employed
in € million in € million in %
2012 2011 2012 2011 2012 2011
BMW Group 8,128 7,637 35,178 29,788 23.1 25.6
Automotive 7,624 7,477 10,165 9,672 75.0 77.3
Motorcycles 9 45 511 442 1.8 10.2