BMW 2012 Annual Report Download - page 113
Download and view the complete annual report
Please find page 113 of the 2012 BMW annual report below. You can navigate through the pages in the report by either clicking on the pages listed below, or by using the keyword search tool below to find specific information within the annual report.-
 1
1 -
2
-
3
-
4
-
5
-
6
-
7
-
8
-
9
-
10
-
11
-
12
-
13
-
14
-
15
-
16
-
17
-
18
-
19
-
20
-
21
-
22
-
23
-
24
-
25
-
26
-
27
-
28
-
29
-
30
-
31
-
32
-
33
-
34
-
35
-
36
-
37
-
38
-
39
-
40
-
41
-
42
-
43
-
44
-
45
-
46
-
47
-
48
-
49
-
50
-
51
-
52
-
53
-
54
-
55
-
56
-
57
-
58
-
59
-
60
-
61
-
62
-
63
-
64
-
65
-
66
-
67
-
68
-
69
-
70
-
71
-
72
-
73
-
74
-
75
-
76
-
77
-
78
-
79
-
80
-
81
-
82
-
83
-
84
-
85
-
86
-
87
-
88
-
89
-
90
-
91
-
92
-
93
-
94
-
95
-
96
-
97
-
98
-
99
-
100
-
101
-
102
-
 103
103 -
 104
104 -
 105
105 -
 106
106 -
 107
107 -
 108
108 -
 109
109 -
 110
110 -
 111
111 -
 112
112 -
 113
113 -
 114
114 -
 115
115 -
 116
116 -
 117
117 -
 118
118 -
 119
119 -
 120
120 -
 121
121 -
 122
122 -
 123
123 -
124
-
125
-
126
-
127
-
128
-
129
-
130
-
131
-
132
-
133
-
134
-
135
-
136
-
137
-
138
-
139
-
140
-
141
-
142
-
143
-
144
-
145
-
146
-
147
-
148
-
149
-
150
-
151
-
152
-
153
-
154
-
155
-
156
-
157
-
158
-
159
-
160
-
161
-
162
-
163
-
164
-
165
-
166
-
167
-
168
-
169
-
170
-
171
-
172
-
173
-
174
-
175
-
176
-
177
-
178
-
179
-
180
-
181
-
182
-
183
-
184
-
185
-
186
-
187
-
188
-
189
-
190
-
191
-
192
-
193
-
194
-
195
-
196
-
197
-
198
-
199
-
200
-
201
-
202
-
203
-
204
-
205
-
206
-
207
-
208
-
209
-
210
-
211
-
212
-
213
-
214
-
215
-
216
-
217
-
218
-
219
-
220
-
221
-
222
-
223
-
224
-
225
-
226
-
227
-
228
-
229
-
230
-
231
-
232
-
233
-
234
-
235
-
236
-
237
-
238
-
239
-
240
-
241
-
242
-
243
-
244
-
245
-
246
-
247
-
248
-
249
-
250
-
251
-
252
-
253
-
254
-
255
-
256
-
257
-
258
-
259
-
260
-
261
-
262
-
263
-
264
-
265
-
266
-
267
-
268
-
269
-
270
-
271
-
272
-
273
-
274
-
275
-
276
-
277
-
278
-
279
-
280
-
281
-
282
-
283
-
284
 |
 |

113 GROUP FINANCIAL STATEMENTS
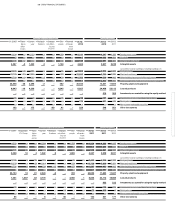
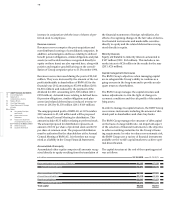
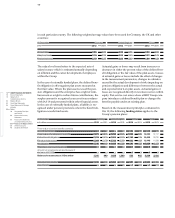
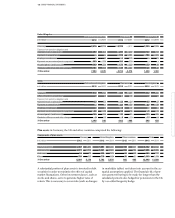
Allowances for impairment on receivables from sales financing developed as follows during the year under report:
2012 Allowance for impairment recognised on a Total
in € million specific item basis group basis
Balance at 1 January* 1,355 262 1,617
Allocated / reversed 298 113 411
Utilised – 314 – 21 – 335
Exchange rate impact and other changes – 71 57 – 14
Balance at 31 December 1,268 411 1,679
* including entities consolidated for the first time during the financial year
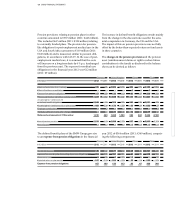
2011 Allowance for impairment recognised on a Total
in € million specific item basis group basis
Balance at 1 January* 1,455 208 1,663
Allocated / reversed 233 67 300
Utilised – 315 – 14 – 329
Exchange rate impact and other changes – 19 1 – 18
Balance at 31 December 1,354 262 1,616
* including entities consolidated for the first time during the financial year
At the end of the reporting period, impairment allow-
ances
of € 411 million (2011: € 262 million) were
recog-
nised on a group basis on gross receivables from sales
financing totalling € 30,813 million (2011: € 28,991 mil-
lion). Impairment allowances of € 1,268 million (2011:
€ 1,354 million) were recognised at 31 December 2012
on a specific item basis on gross receivables from sales
financing totalling € 11,149 million (2011: € 10,981 million).
Receivables from sales financing which were not over-
due at the end of the reporting period amounted to
€ 12,631 million (2011: € 10,989 million). No impairment
losses were recognised for these balances.
The estimated fair value of collateral received for receiv-
ables on which impairment losses were recognised to-
talled € 21,649 million (2011: € 19,916 million) at the end
of the reporting period. This collateral related primarily
to vehicles. The carrying amount of assets held as
col-
lateral and taken back as a result of payment default
amounted to € 37 million (2011: € 41 million).
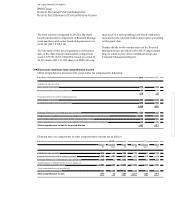
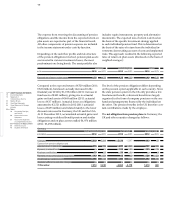
in € million 31. 12. 2012 31. 12. 2011
Derivative instruments 2,992 2,358
Marketable securities and investment funds 2,655 2,330
Loans to third parties 44 23
Credit card receivables 234 249
Other 835 493
Financial assets 6,760 5,453
thereof non-current 2,148 1,702
thereof current 4,612 3,751
26
Financial assets
Financial assets comprise:
The increase in derivative instruments was primarily
attributable to positive market price developments of
currency derivatives.
The rise in marketable securities and investment funds
reflects primarily an increase in the BMW Group’s
strategic liquidity reserve.