BMW 2012 Annual Report Download - page 57
Download and view the complete annual report
Please find page 57 of the 2012 BMW annual report below. You can navigate through the pages in the report by either clicking on the pages listed below, or by using the keyword search tool below to find specific information within the annual report.-
 1
1 -
2
-
3
-
4
-
5
-
6
-
7
-
8
-
9
-
10
-
11
-
12
-
13
-
14
-
15
-
16
-
17
-
18
-
19
-
20
-
21
-
22
-
23
-
24
-
25
-
26
-
27
-
28
-
29
-
30
-
31
-
32
-
33
-
34
-
35
-
36
-
37
-
38
-
39
-
40
-
41
-
42
-
43
-
44
-
45
-
46
-
 47
47 -
 48
48 -
 49
49 -
 50
50 -
 51
51 -
 52
52 -
 53
53 -
 54
54 -
 55
55 -
 56
56 -
 57
57 -
 58
58 -
 59
59 -
 60
60 -
 61
61 -
 62
62 -
 63
63 -
 64
64 -
 65
65 -
 66
66 -
 67
67 -
68
-
69
-
70
-
71
-
72
-
73
-
74
-
75
-
76
-
77
-
78
-
79
-
80
-
81
-
82
-
83
-
84
-
85
-
86
-
87
-
88
-
89
-
90
-
91
-
92
-
93
-
94
-
95
-
96
-
97
-
98
-
99
-
100
-
101
-
102
-
103
-
104
-
105
-
106
-
107
-
108
-
109
-
110
-
111
-
112
-
113
-
114
-
115
-
116
-
117
-
118
-
119
-
120
-
121
-
122
-
123
-
124
-
125
-
126
-
127
-
128
-
129
-
130
-
131
-
132
-
133
-
134
-
135
-
136
-
137
-
138
-
139
-
140
-
141
-
142
-
143
-
144
-
145
-
146
-
147
-
148
-
149
-
150
-
151
-
152
-
153
-
154
-
155
-
156
-
157
-
158
-
159
-
160
-
161
-
162
-
163
-
164
-
165
-
166
-
167
-
168
-
169
-
170
-
171
-
172
-
173
-
174
-
175
-
176
-
177
-
178
-
179
-
180
-
181
-
182
-
183
-
184
-
185
-
186
-
187
-
188
-
189
-
190
-
191
-
192
-
193
-
194
-
195
-
196
-
197
-
198
-
199
-
200
-
201
-
202
-
203
-
204
-
205
-
206
-
207
-
208
-
209
-
210
-
211
-
212
-
213
-
214
-
215
-
216
-
217
-
218
-
219
-
220
-
221
-
222
-
223
-
224
-
225
-
226
-
227
-
228
-
229
-
230
-
231
-
232
-
233
-
234
-
235
-
236
-
237
-
238
-
239
-
240
-
241
-
242
-
243
-
244
-
245
-
246
-
247
-
248
-
249
-
250
-
251
-
252
-
253
-
254
-
255
-
256
-
257
-
258
-
259
-
260
-
261
-
262
-
263
-
264
-
265
-
266
-
267
-
268
-
269
-
270
-
271
-
272
-
273
-
274
-
275
-
276
-
277
-
278
-
279
-
280
-
281
-
282
-
283
-
284
 |
 |

57 COMBINED GROUP AND COMPANY MANAGEMENT REPORT
European capital markets. Bonds were also issued in
Canadian dollars, British pounds, Norwegian krone, In-
dian rupees, South Korean won and other currencies
for a total amount of € 5.1 billion.
A total of eight ABS transactions were executed in 2012,
including two public transactions in the USA and one
each in Germany and South Africa with a total volume
equivalent to € 2.3 billion. Further funds were also raised
via new ABS conduit transactions in Japan, Australia
and the UK totalling € 1.7 billion.
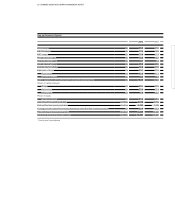
The regular issue of commercial paper also strengthens
our financial base. The following table provides an over-
view of existing money and capital market programmes
of the BMW Group at 31 December 2012:
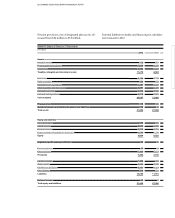
visions (81.6 %), trade payables (20.5 %), non-current
financial liabilities (4.0 %) and other provisions (8.7 %).
Deferred tax liabilities (7.1 %) and current other lia-
bilities (3.3 %) decreased.
At € 5,207 million, the carrying amount of intangible as-
sets was € 31 million lower than at the end of the pre-
vious year. Within intangible assets, capitalised develop-
ment costs decreased by € 41 million to € 4,347 million.
Development costs recognised as assets during the year
under report totalled € 1,089 million (+12.0 %) and
were
therefore higher than one year earlier. The propor-
tion of research and development costs recognised as
assets was 27.6 % (2011: 28.8 %). The corresponding am-
ortisation expense was € 1,130 million (2011: € 1,209 mil-
lion). Goodwill was unchanged from the previous year
and stood at € 369 million.
Property, plant and equipment rose sharply to
€ 13,341 million. Capital expenditure of € 4,028 mil-
lion
was 55.0 % higher than in the previous year (2011:
€ 2,598 million). The main focus was on product invest-
ments
for production start-ups and infrastructure
improvements. Depreciation on property, plant and
equipment totalled € 2,298 million. Total capital ex-
penditure on intangible assets and property, plant and
equipment
as a percentage of revenues increased to
6.8 % (2011: 5.4 %).
Leased products climbed by € 1,356 million or 5.9 % as
a result of increased business volumes. Adjusted for ex-
change rate factors, the increase was 6.1 %.
Receivables from sales financing increased by 7.2 % to
€ 52,914 million due to higher business volumes. Of
this amount, customer and dealer financing accounted
for € 40,650 million (6.1 %) and finance leases for
€ 12,264 million (11.0 %).
Compared to the end of the previous financial year,
in-
ventories went up only marginally by € 87 million
(+0.9 %) to € 9,725 million. Adjusted for exchange rate
factors, the increase was 1.3 %.
Financial assets went up by 24.0 % to € 6,760 million,
largely due to higher levels of marketable securities
and investment fund shares as well as increases in fair
values of currency derivatives.
Liquid funds went up by 9.1 % to € 11,025 million and
comprise cash and cash equivalents, marketable securi-
ties and investment fund shares (the last two items re-
ported as financial assets).
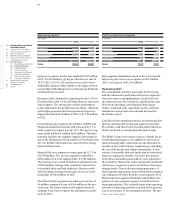
Programme Amount utilised
Euro Medium Term Notes € 25.5 billion
Commercial paper € 4.7 billion
The BMW Group’s liquidity position is extremely robust,
with cash funds totalling € 11.0 billion on hand at 31 De-
cember 2012. A syndicated credit line of € 6 billion is
also in place. The credit line, which is being made avail-
able at attractive conditions by a consortium of 39 inter-
national banks, has a term up to October 2017 and can
be extended by one year.
Further information with respect to financial liabilities
is provided in the notes to the Group Financial State-
ments
33 and 37.
Net assets position
The Group balance sheet total increased by € 8,421 mil-
lion to stand at € 131,850 million at 31 December 2012.
Adjusted for changes in exchange rates, the balance
sheet total increased by 7.5 %.
The main factors behind the increase on the assets
side of the balance sheet were receivables from sales
financing (7.2 %), property, plant and equipment
(14.2 %), leased products (5.9 %) and financial assets
(24.0 %). By contrast, trade receivables went down by
22.6 % thanks to proactive receivables management.
Inventories increased marginally (0.9 %) compared to
the previous year.
On the equity and liabilities side of the balance sheet,
the increase related to equity (12.2 %), pension pro-