BMW 2012 Annual Report Download - page 120
Download and view the complete annual report
Please find page 120 of the 2012 BMW annual report below. You can navigate through the pages in the report by either clicking on the pages listed below, or by using the keyword search tool below to find specific information within the annual report.-
 1
1 -
2
-
3
-
4
-
5
-
6
-
7
-
8
-
9
-
10
-
11
-
12
-
13
-
14
-
15
-
16
-
17
-
18
-
19
-
20
-
21
-
22
-
23
-
24
-
25
-
26
-
27
-
28
-
29
-
30
-
31
-
32
-
33
-
34
-
35
-
36
-
37
-
38
-
39
-
40
-
41
-
42
-
43
-
44
-
45
-
46
-
47
-
48
-
49
-
50
-
51
-
52
-
53
-
54
-
55
-
56
-
57
-
58
-
59
-
60
-
61
-
62
-
63
-
64
-
65
-
66
-
67
-
68
-
69
-
70
-
71
-
72
-
73
-
74
-
75
-
76
-
77
-
78
-
79
-
80
-
81
-
82
-
83
-
84
-
85
-
86
-
87
-
88
-
89
-
90
-
91
-
92
-
93
-
94
-
95
-
96
-
97
-
98
-
99
-
100
-
101
-
102
-
103
-
104
-
105
-
106
-
107
-
108
-
109
-
 110
110 -
 111
111 -
 112
112 -
 113
113 -
 114
114 -
 115
115 -
 116
116 -
 117
117 -
 118
118 -
 119
119 -
 120
120 -
 121
121 -
 122
122 -
 123
123 -
 124
124 -
 125
125 -
 126
126 -
 127
127 -
 128
128 -
 129
129 -
 130
130 -
131
-
132
-
133
-
134
-
135
-
136
-
137
-
138
-
139
-
140
-
141
-
142
-
143
-
144
-
145
-
146
-
147
-
148
-
149
-
150
-
151
-
152
-
153
-
154
-
155
-
156
-
157
-
158
-
159
-
160
-
161
-
162
-
163
-
164
-
165
-
166
-
167
-
168
-
169
-
170
-
171
-
172
-
173
-
174
-
175
-
176
-
177
-
178
-
179
-
180
-
181
-
182
-
183
-
184
-
185
-
186
-
187
-
188
-
189
-
190
-
191
-
192
-
193
-
194
-
195
-
196
-
197
-
198
-
199
-
200
-
201
-
202
-
203
-
204
-
205
-
206
-
207
-
208
-
209
-
210
-
211
-
212
-
213
-
214
-
215
-
216
-
217
-
218
-
219
-
220
-
221
-
222
-
223
-
224
-
225
-
226
-
227
-
228
-
229
-
230
-
231
-
232
-
233
-
234
-
235
-
236
-
237
-
238
-
239
-
240
-
241
-
242
-
243
-
244
-
245
-
246
-
247
-
248
-
249
-
250
-
251
-
252
-
253
-
254
-
255
-
256
-
257
-
258
-
259
-
260
-
261
-
262
-
263
-
264
-
265
-
266
-
267
-
268
-
269
-
270
-
271
-
272
-
273
-
274
-
275
-
276
-
277
-
278
-
279
-
280
-
281
-
282
-
283
-
284
 |
 |

120
78 GROUP FINANCIAL STATEMENTS
78 Income Statements
78 Statement of
Comprehensive Income
80 Balance Sheets
82 Cash Flow Statements
84 Group Statement of Changes
in Equity
86 Notes
86 Accounting Principles
and Policies
100 Notes to the Income
Statement
107 Notes to the Statement
of Comprehensive Income
108
Notes to the Balance Sheet
129 Other Disclosures
145 Segment Information
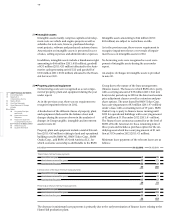
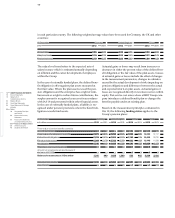
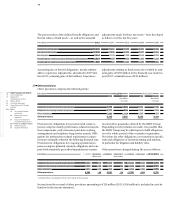
in each particular country. The following weighted average values have been used for Germany, the UK and other
countries:
31 December Germany United Kingdom Other
in % 2012 2011 2012 2011 2012 2011
Discount rate 3.00 4.75 4.25 4.75 3.82 4.57
Salary level trend 3.18 3.35 3.50 3.65 3.57 3.43
Pension level trend 2.18 2.35 2.92 3.09 1.84 1.59
The salary level trend refers to the expected rate of
salary increase which is estimated annually depending
on inflation and the career development of employees
within the Group.
In the case of externally funded plans, the defined bene-
fit obligation is offset against plan assets measured at
their fair value. Where the plan assets exceed the pen-
sion obligations and the enterprise has a right of reim-
bursement or a right to reduce future contributions, the
surplus amount is recognised as an asset in accordance
with IAS 19 and presented within other financial assets.
In the case of externally funded plans, a liability is rec-
ognised under pension provisions where the benefit ob-
ligation exceeds fund assets.
Actuarial gains or losses may result from increases or
decreases in either the present value of the defined ben-
efit obligation or the fair value of the plan assets. Causes
of actuarial gains or losses include the effect of changes
in the measurement parameters, changes in estimates
caused by the actual development of risks impacting on
pension obligations and differences between the actual
and expected return on plan assets. Actuarial gains or
losses are recognised directly in revenue reserves within
equity. Past service cost arises where a BMW Group
com-
pany introduces a defined benefit plan or changes the
benefits payable under an existing plan.
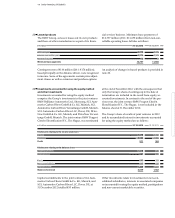
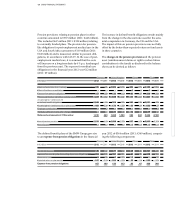
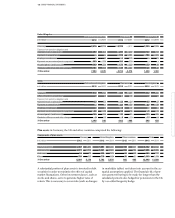
Based on the measurement principles contained in
IAS 19, the following funding status applies to the
Group’s pension plans:
31 December Germany United Kingdom Other Total
in € million 2012 2011 2012 2011 2012 2011 2012 2011
Present value of pension benefits covered by
accounting provisions
3 2 – – 110 93 113 95
Present value of funded pension benefits 7,971 5,616 7,280 6,676 1,038 825 16,289 13,117
Defined benefit obligations 7,974 5,618 7,280 6,676 1,148 918 16,402 13,212
Fair value of plan assets 6,064 5,178 5,782 5,376 602 485 12,448 11,039
Net obligation 1,910 440 1,498 1,300 546 433 3,954 2,173
Past service cost not yet recognised – – – – 6 6 6 6
Amount not recognised as an asset because of
the limit in IAS 19.58 – – – – 4 3 4 3
Balance sheet amounts at 31 December 1,910 440 1,498 1,300 556 442 3,964 2,182
thereof pension provision 1,910 440 1,498 1,300 557 443 3,965 2,183
thereof assets – – – – – 1 – 1 – 1 – 1