BMW 2012 Annual Report Download - page 58
Download and view the complete annual report
Please find page 58 of the 2012 BMW annual report below. You can navigate through the pages in the report by either clicking on the pages listed below, or by using the keyword search tool below to find specific information within the annual report.-
 1
1 -
2
-
3
-
4
-
5
-
6
-
7
-
8
-
9
-
10
-
11
-
12
-
13
-
14
-
15
-
16
-
17
-
18
-
19
-
20
-
21
-
22
-
23
-
24
-
25
-
26
-
27
-
28
-
29
-
30
-
31
-
32
-
33
-
34
-
35
-
36
-
37
-
38
-
39
-
40
-
41
-
42
-
43
-
44
-
45
-
46
-
47
-
 48
48 -
 49
49 -
 50
50 -
 51
51 -
 52
52 -
 53
53 -
 54
54 -
 55
55 -
 56
56 -
 57
57 -
 58
58 -
 59
59 -
 60
60 -
 61
61 -
 62
62 -
 63
63 -
 64
64 -
 65
65 -
 66
66 -
 67
67 -
 68
68 -
69
-
70
-
71
-
72
-
73
-
74
-
75
-
76
-
77
-
78
-
79
-
80
-
81
-
82
-
83
-
84
-
85
-
86
-
87
-
88
-
89
-
90
-
91
-
92
-
93
-
94
-
95
-
96
-
97
-
98
-
99
-
100
-
101
-
102
-
103
-
104
-
105
-
106
-
107
-
108
-
109
-
110
-
111
-
112
-
113
-
114
-
115
-
116
-
117
-
118
-
119
-
120
-
121
-
122
-
123
-
124
-
125
-
126
-
127
-
128
-
129
-
130
-
131
-
132
-
133
-
134
-
135
-
136
-
137
-
138
-
139
-
140
-
141
-
142
-
143
-
144
-
145
-
146
-
147
-
148
-
149
-
150
-
151
-
152
-
153
-
154
-
155
-
156
-
157
-
158
-
159
-
160
-
161
-
162
-
163
-
164
-
165
-
166
-
167
-
168
-
169
-
170
-
171
-
172
-
173
-
174
-
175
-
176
-
177
-
178
-
179
-
180
-
181
-
182
-
183
-
184
-
185
-
186
-
187
-
188
-
189
-
190
-
191
-
192
-
193
-
194
-
195
-
196
-
197
-
198
-
199
-
200
-
201
-
202
-
203
-
204
-
205
-
206
-
207
-
208
-
209
-
210
-
211
-
212
-
213
-
214
-
215
-
216
-
217
-
218
-
219
-
220
-
221
-
222
-
223
-
224
-
225
-
226
-
227
-
228
-
229
-
230
-
231
-
232
-
233
-
234
-
235
-
236
-
237
-
238
-
239
-
240
-
241
-
242
-
243
-
244
-
245
-
246
-
247
-
248
-
249
-
250
-
251
-
252
-
253
-
254
-
255
-
256
-
257
-
258
-
259
-
260
-
261
-
262
-
263
-
264
-
265
-
266
-
267
-
268
-
269
-
270
-
271
-
272
-
273
-
274
-
275
-
276
-
277
-
278
-
279
-
280
-
281
-
282
-
283
-
284
 |
 |

58
18 COMBINED GROUP AND COMPANY
MANAGEMENT REPORT
18 A Review of the Financial Year
21 General Economic Environment
24 Review of Operations
44 BMW Stock and Capital Market
47 Disclosures relevant for takeovers
and explanatory comments
50 Financial Analysis
50 Internal Management System
52 Earnings Performance
54 Financial Position
57 Net Assets Position
59 Subsequent Events Report
59 Value Added Statement
61 Key Performance Figures
62 Comments on BMW AG
65 Internal Control System and
explanatory comments
66 Risk Management
74 Outlook
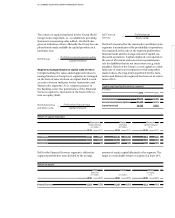
Cash and cash equivalents went up by € 594 million to
€ 8,370 million.
On the equity and liabilities side of the balance sheet,
equity rose overall by € 3,299 million (+12.2 %) to
€ 30,402 million. The main reason for the increase was
the profit attributable to shareholders of BMW AG to-
talling € 5,096 million. Translation differences arising
on currency translation reduced equity by € 123 million.
Deferred taxes on items recognised directly in equity
increased equity by € 49 million. Actuarial losses on
pen-
sion obligations mainly due to lower interest rates
caused Group equity to reduce by € 1,881 million. Changes
in fair value gains and losses of derivative financial
in struments (€ 1,302 million) and marketable securities
(€ 214 million) had a positive impact on equity. Income
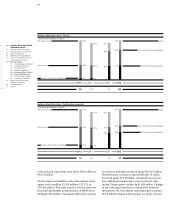
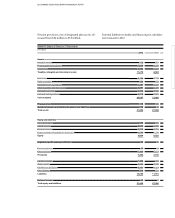
Balance sheet structure – Group
Total equity and liabilities in € billion
2012 2011 2011 2012
132 123 123 132
Non-current assets 62 %
6 %
40 %
60 %
38 %
40 %
22 %
38 %
Current assets
6 %
thereof cash and cash equivalents
40 % Non-current provisions and liabilities
37 % Current provisions and liabilities
23 % Equity
Balance sheet structure – Automotive segment
Total equity and liabilities in € billion
2012 2011 2011 2012
69 64 64 69
Non-current assets 44 %
9 %
58 %
42 %
44 %
15 %
41 %
56 %
Current assets
11 %
thereof cash and cash equivalents
16 % Non-current provisions and liabilities
43 % Current provisions and liabilities
41 % Equity