BMW 2012 Annual Report Download - page 60
Download and view the complete annual report
Please find page 60 of the 2012 BMW annual report below. You can navigate through the pages in the report by either clicking on the pages listed below, or by using the keyword search tool below to find specific information within the annual report.-
 1
1 -
2
-
3
-
4
-
5
-
6
-
7
-
8
-
9
-
10
-
11
-
12
-
13
-
14
-
15
-
16
-
17
-
18
-
19
-
20
-
21
-
22
-
23
-
24
-
25
-
26
-
27
-
28
-
29
-
30
-
31
-
32
-
33
-
34
-
35
-
36
-
37
-
38
-
39
-
40
-
41
-
42
-
43
-
44
-
45
-
46
-
47
-
48
-
49
-
 50
50 -
 51
51 -
 52
52 -
 53
53 -
 54
54 -
 55
55 -
 56
56 -
 57
57 -
 58
58 -
 59
59 -
 60
60 -
 61
61 -
 62
62 -
 63
63 -
 64
64 -
 65
65 -
 66
66 -
 67
67 -
 68
68 -
 69
69 -
 70
70 -
71
-
72
-
73
-
74
-
75
-
76
-
77
-
78
-
79
-
80
-
81
-
82
-
83
-
84
-
85
-
86
-
87
-
88
-
89
-
90
-
91
-
92
-
93
-
94
-
95
-
96
-
97
-
98
-
99
-
100
-
101
-
102
-
103
-
104
-
105
-
106
-
107
-
108
-
109
-
110
-
111
-
112
-
113
-
114
-
115
-
116
-
117
-
118
-
119
-
120
-
121
-
122
-
123
-
124
-
125
-
126
-
127
-
128
-
129
-
130
-
131
-
132
-
133
-
134
-
135
-
136
-
137
-
138
-
139
-
140
-
141
-
142
-
143
-
144
-
145
-
146
-
147
-
148
-
149
-
150
-
151
-
152
-
153
-
154
-
155
-
156
-
157
-
158
-
159
-
160
-
161
-
162
-
163
-
164
-
165
-
166
-
167
-
168
-
169
-
170
-
171
-
172
-
173
-
174
-
175
-
176
-
177
-
178
-
179
-
180
-
181
-
182
-
183
-
184
-
185
-
186
-
187
-
188
-
189
-
190
-
191
-
192
-
193
-
194
-
195
-
196
-
197
-
198
-
199
-
200
-
201
-
202
-
203
-
204
-
205
-
206
-
207
-
208
-
209
-
210
-
211
-
212
-
213
-
214
-
215
-
216
-
217
-
218
-
219
-
220
-
221
-
222
-
223
-
224
-
225
-
226
-
227
-
228
-
229
-
230
-
231
-
232
-
233
-
234
-
235
-
236
-
237
-
238
-
239
-
240
-
241
-
242
-
243
-
244
-
245
-
246
-
247
-
248
-
249
-
250
-
251
-
252
-
253
-
254
-
255
-
256
-
257
-
258
-
259
-
260
-
261
-
262
-
263
-
264
-
265
-
266
-
267
-
268
-
269
-
270
-
271
-
272
-
273
-
274
-
275
-
276
-
277
-
278
-
279
-
280
-
281
-
282
-
283
-
284
 |
 |
60
18 COMBINED GROUP AND COMPANY
MANAGEMENT REPORT
18 A Review of the Financial Year
21 General Economic Environment
24 Review of Operations
44 BMW Stock and Capital Market
47 Disclosures relevant for takeovers
and explanatory comments
50 Financial Analysis
50 Internal Management System
52 Earnings Performance
54 Financial Position
57 Net Assets Position
59 Subsequent Events Report
59 Value Added Statement
61 Key Performance Figures
62 Comments on BMW AG
65 Internal Control System and
explanatory comments
66 Risk Management
74 Outlook
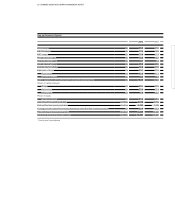
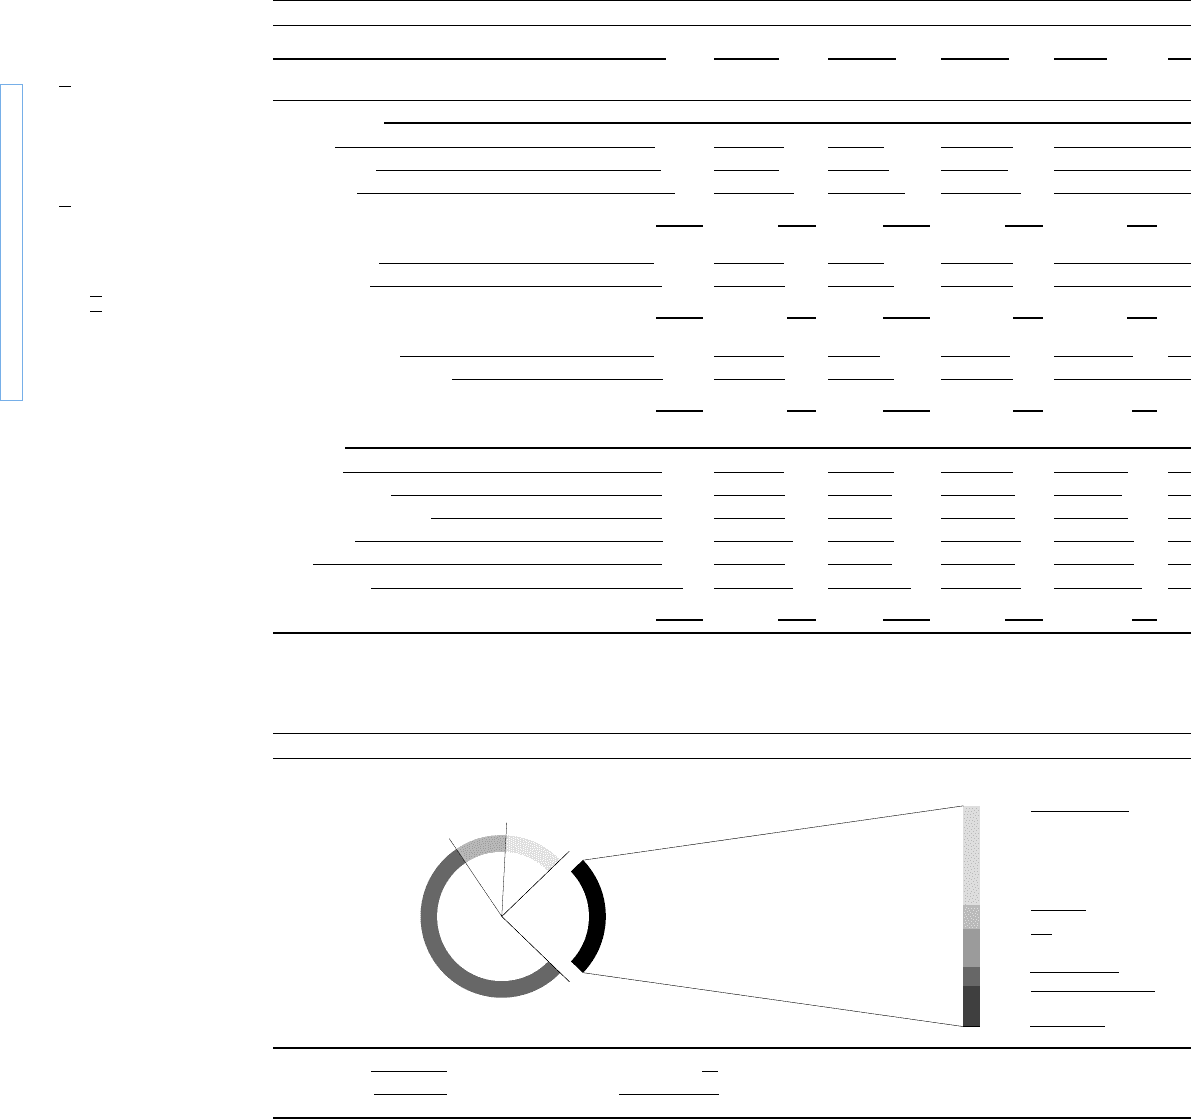
BMW Group value added statement
2012 2012 2011 2011 Change
in € million in % in € million in % in %
Work performed
Revenues 76,848 99.3 68,821 99.5
Financial income – 270 – 0.4 – 400 – 0.6
Other income 829 1.1 782 1.1
Total output 77,407 100.0 69,203 100.0 11.9
Cost of materials* 41,304 53.4 36,753 53.1
Other expenses 9,173 11.8 7,261 10.5
Bought-in costs 50,477 65.2 44,014 63.6 14.7
Gross value added 26,930 34.8 25,189 36.4 6.9
Depreciation and amortisation 7,955 10.3 7,424 10.7
Net value added 18,975 24.5 17,765 25.7 6.8
Applied to
Employees 8,535 45.0 7,739 43.6 10.3
Providers of finance 2,030 10.7 2,149 12.1 – 5.5
Government / public sector 3,288 17.3 2,970 16.7 10.7
Shareholders 1,640 8.7 1,508 8.5 8.8
Group 3,456 18.2 3,373 19.0 2.5
Minority interest 26 0.1 26 0.1 –
Net value added 18,975 100.0 17,765 100.0 6.8
* Cost of materials comprises all primary material costs incurred for vehicle production plus ancillary material costs (such as customs duties, insurance premiums and freight).
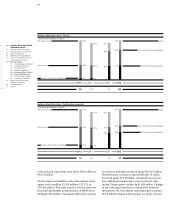
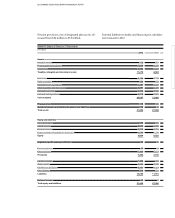
BMW Group value added 2012
in %
Net value added 24.5 Depreciation and amortisation 10.3
Cost of materials 53.4 Other expenses 11.8
Other expenses
Net value added
Cost of materials
Depreciation and amortisation
45.0 % Employees
10.7 % Providers of finance
17.3 % Government / public sector
8.7 % Shareholders
18.2 % Group
0.1 % Minority interest