BMW 2012 Annual Report Download - page 42
Download and view the complete annual report
Please find page 42 of the 2012 BMW annual report below. You can navigate through the pages in the report by either clicking on the pages listed below, or by using the keyword search tool below to find specific information within the annual report.-
 1
1 -
2
-
3
-
4
-
5
-
6
-
7
-
8
-
9
-
10
-
11
-
12
-
13
-
14
-
15
-
16
-
17
-
18
-
19
-
20
-
21
-
22
-
23
-
24
-
25
-
26
-
27
-
28
-
29
-
30
-
31
-
 32
32 -
 33
33 -
 34
34 -
 35
35 -
 36
36 -
 37
37 -
 38
38 -
 39
39 -
 40
40 -
 41
41 -
 42
42 -
 43
43 -
 44
44 -
 45
45 -
 46
46 -
 47
47 -
 48
48 -
 49
49 -
 50
50 -
 51
51 -
 52
52 -
53
-
54
-
55
-
56
-
57
-
58
-
59
-
60
-
61
-
62
-
63
-
64
-
65
-
66
-
67
-
68
-
69
-
70
-
71
-
72
-
73
-
74
-
75
-
76
-
77
-
78
-
79
-
80
-
81
-
82
-
83
-
84
-
85
-
86
-
87
-
88
-
89
-
90
-
91
-
92
-
93
-
94
-
95
-
96
-
97
-
98
-
99
-
100
-
101
-
102
-
103
-
104
-
105
-
106
-
107
-
108
-
109
-
110
-
111
-
112
-
113
-
114
-
115
-
116
-
117
-
118
-
119
-
120
-
121
-
122
-
123
-
124
-
125
-
126
-
127
-
128
-
129
-
130
-
131
-
132
-
133
-
134
-
135
-
136
-
137
-
138
-
139
-
140
-
141
-
142
-
143
-
144
-
145
-
146
-
147
-
148
-
149
-
150
-
151
-
152
-
153
-
154
-
155
-
156
-
157
-
158
-
159
-
160
-
161
-
162
-
163
-
164
-
165
-
166
-
167
-
168
-
169
-
170
-
171
-
172
-
173
-
174
-
175
-
176
-
177
-
178
-
179
-
180
-
181
-
182
-
183
-
184
-
185
-
186
-
187
-
188
-
189
-
190
-
191
-
192
-
193
-
194
-
195
-
196
-
197
-
198
-
199
-
200
-
201
-
202
-
203
-
204
-
205
-
206
-
207
-
208
-
209
-
210
-
211
-
212
-
213
-
214
-
215
-
216
-
217
-
218
-
219
-
220
-
221
-
222
-
223
-
224
-
225
-
226
-
227
-
228
-
229
-
230
-
231
-
232
-
233
-
234
-
235
-
236
-
237
-
238
-
239
-
240
-
241
-
242
-
243
-
244
-
245
-
246
-
247
-
248
-
249
-
250
-
251
-
252
-
253
-
254
-
255
-
256
-
257
-
258
-
259
-
260
-
261
-
262
-
263
-
264
-
265
-
266
-
267
-
268
-
269
-
270
-
271
-
272
-
273
-
274
-
275
-
276
-
277
-
278
-
279
-
280
-
281
-
282
-
283
-
284
 |
 |

42
18 COMBINED GROUP AND COMPANY
MANAGEMENT REPORT
18 A Review of the Financial Year
21 General Economic Environment
24 Review of Operations
24 Automotive segment
30 Motorcycles segment
31 Financial Services segment
33 Research and development
36 Purchasing
37 Sales and Marketing
39 Workforce
41 Sustainability
44 BMW Stock and Capital Market
47 Disclosures relevant for takeovers
and explanatory comments
50 Financial Analysis
65 Internal Control System and
explanatory comments
66 Risk Management
74 Outlook
The high number of model start-ups, the increasing
number of models being launched and the greater verti-
cal range of manufacture, such as with CFRP, were the
main challenges in our endeavours to improve energy
efficiency. Expansion of our highly efficient and ecologi-
cally sustainable combined heat and power plants led to
higher consumption due to conversion factors. Despite
this fact we managed to reduce the energy consumed
per vehicle produced in 2012 to 2.44 MWh (– 0.8 %). This
improvement was achieved by means of a number of
measures such as the use of waste heat from the paint
shop at the Leipzig plant and the use of energy-efficient
motors for cooling the computer centre at our Oxford
plant. Greater energy efficiency and the use of electric-
ity produced from regenerative sources helped to re-
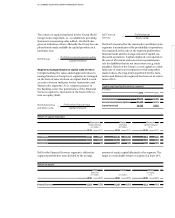
duce the CO2 emissions per vehicle produced by 4.2 %
to 0.68 tonnes during the period under report.
The volume of water required per vehicle produced also
fell to 2.10 m3 (– 0.9 %) in 2012. The amount of process
wastewater produced decreased by 11.1 % to 0.48 m3 per
vehicle produced. The conversion of the paint shop
in
Spartanburg to a water-free paint process and the re-
use of water in the paint shops at the Dingolfing and
Munich
plants were the main contributing factors to
this
reduction.
The volume of non-recyclable production waste was re-
duced by a further 23.5 % to 6.11 kg per vehicle pro-
duced in 2012. The primary reason for the improvement
was the conversion from waste disposal to recycling at
all plants in the UK.
Solvent emissions increased slightly by 1.8 % to 1.68 kg
per vehicle produced during the period under report,
largely due to increased production volumes in China.
New, eco-friendly painting processes will come on line
at the Tiexi* plant by the end of 2013. The paint shop
at the Dadong* plant is also scheduled for retrofitting
with a view to minimising solvent emissions in years to
come.
* Joint venture BMW Brilliance
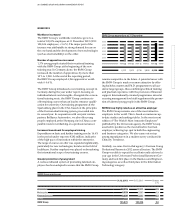
Eco-friendly transportation solutions
The general increase in production volume combined
with regional shifts in demand had an impact on the
CO2 emissions per vehicle produced
in t / vehicle
0.90
0.85
0.80
0.75
0.70
0.65
08 09 10 11 12
0.82 0.91 0.86 0.71 0.68
Process wastewater per vehicle produced
in m3 / vehicle
0.70
0.60
0.50
0.40
0.30
0.20
08 09 10 11 12
0.64 0.62 0.58 0.54 0.48
Waste for disposal per vehicle produced
in kg / vehicle
17.5
15.0
12.5
10.0
7.5
5.0
08 09 10 11 12
14.84 10.63 10.09 7.99 6.11
Volatile organic compounds (VOC)
per vehicle produced
in kg / vehicle
2.50
2.25
2.00
1.75
1.50
08 09 10 11 12
1.96 1.77 1.60 1.65 1.68