BMW 2012 Annual Report Download - page 108
Download and view the complete annual report
Please find page 108 of the 2012 BMW annual report below. You can navigate through the pages in the report by either clicking on the pages listed below, or by using the keyword search tool below to find specific information within the annual report.-
 1
1 -
2
-
3
-
4
-
5
-
6
-
7
-
8
-
9
-
10
-
11
-
12
-
13
-
14
-
15
-
16
-
17
-
18
-
19
-
20
-
21
-
22
-
23
-
24
-
25
-
26
-
27
-
28
-
29
-
30
-
31
-
32
-
33
-
34
-
35
-
36
-
37
-
38
-
39
-
40
-
41
-
42
-
43
-
44
-
45
-
46
-
47
-
48
-
49
-
50
-
51
-
52
-
53
-
54
-
55
-
56
-
57
-
58
-
59
-
60
-
61
-
62
-
63
-
64
-
65
-
66
-
67
-
68
-
69
-
70
-
71
-
72
-
73
-
74
-
75
-
76
-
77
-
78
-
79
-
80
-
81
-
82
-
83
-
84
-
85
-
86
-
87
-
88
-
89
-
90
-
91
-
92
-
93
-
94
-
95
-
96
-
97
-
 98
98 -
 99
99 -
 100
100 -
 101
101 -
 102
102 -
 103
103 -
 104
104 -
 105
105 -
 106
106 -
 107
107 -
 108
108 -
 109
109 -
 110
110 -
 111
111 -
 112
112 -
 113
113 -
 114
114 -
 115
115 -
 116
116 -
 117
117 -
 118
118 -
119
-
120
-
121
-
122
-
123
-
124
-
125
-
126
-
127
-
128
-
129
-
130
-
131
-
132
-
133
-
134
-
135
-
136
-
137
-
138
-
139
-
140
-
141
-
142
-
143
-
144
-
145
-
146
-
147
-
148
-
149
-
150
-
151
-
152
-
153
-
154
-
155
-
156
-
157
-
158
-
159
-
160
-
161
-
162
-
163
-
164
-
165
-
166
-
167
-
168
-
169
-
170
-
171
-
172
-
173
-
174
-
175
-
176
-
177
-
178
-
179
-
180
-
181
-
182
-
183
-
184
-
185
-
186
-
187
-
188
-
189
-
190
-
191
-
192
-
193
-
194
-
195
-
196
-
197
-
198
-
199
-
200
-
201
-
202
-
203
-
204
-
205
-
206
-
207
-
208
-
209
-
210
-
211
-
212
-
213
-
214
-
215
-
216
-
217
-
218
-
219
-
220
-
221
-
222
-
223
-
224
-
225
-
226
-
227
-
228
-
229
-
230
-
231
-
232
-
233
-
234
-
235
-
236
-
237
-
238
-
239
-
240
-
241
-
242
-
243
-
244
-
245
-
246
-
247
-
248
-
249
-
250
-
251
-
252
-
253
-
254
-
255
-
256
-
257
-
258
-
259
-
260
-
261
-
262
-
263
-
264
-
265
-
266
-
267
-
268
-
269
-
270
-
271
-
272
-
273
-
274
-
275
-
276
-
277
-
278
-
279
-
280
-
281
-
282
-
283
-
284
 |
 |
108
78 GROUP FINANCIAL STATEMENTS
78 Income Statements
78 Statement of
Comprehensive Income
80 Balance Sheets
82 Cash Flow Statements
84 Group Statement of Changes
in Equity
86 Notes
86 Accounting Principles
and Policies
100 Notes to the Income
Statement
107 Notes to the Statement
of Comprehensive Income
108
Notes to the Balance Sheet
129 Other Disclosures
145 Segment Information
BMW Group
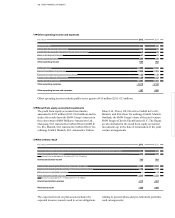
Notes to the Group Financial Statements
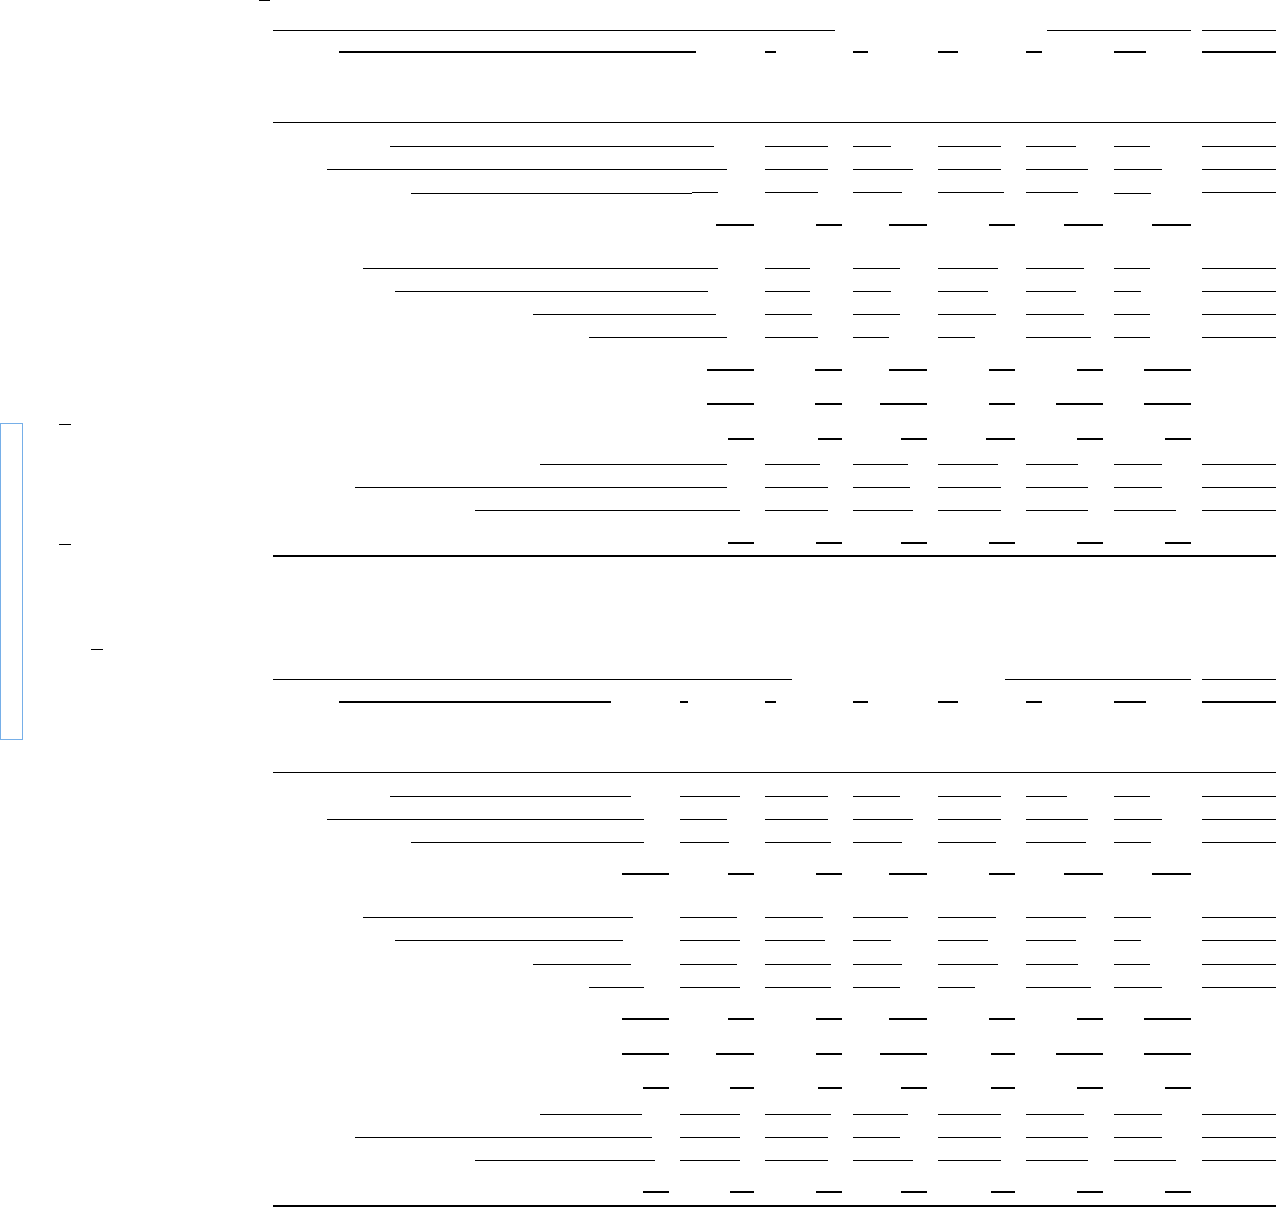
Notes to the Balance Sheet
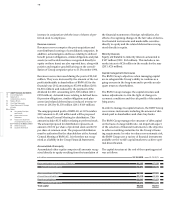
20
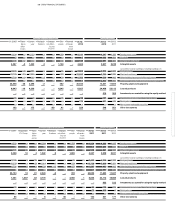
Analysis of changes in Group tangible, intangible and investment assets 2012
Analysis of changes in Group tangible, intangible and investment assets 2011
Acquisition and manufacturing cost
in € million 1. 1. 20111
Acquisition
Translation Additions Reclassi- Disposals 31. 12 .
ICL Group differences fications 2011
Development costs 9,147 – – 972 – 1,727 8,392
Goodwill 116 258 – – – – 374
Other intangible assets 796 153 5 122 41 78 1,039
Intangible assets 10,059 411 5 1,094 41 1,805 9,805
Land, titles to land, buildings, including buildings on
third party land 7,571 19 47 90 48 17 7,758
Plant and machinery 24,166 – 79 1,483 464 567 25,625
Other facilities, factory and office equipment 2,143 16 9 163 12 183 2,160
Advance payments made and construction in progress
700 – 3 862 – 565 8 992
Property, plant and equipment 34,580 35 138 2,598 – 41 775 36,535
Leased products 26,449 5,072 343 11,252 – 11,160 31,956
Investments accounted for using the equity method
212 – – 113 – 23 302
Investments in non-consolidated subsidiaries 251 – 2 54 – 85 222
Participations 12 – – 489 – – 501
Non-current marketable securities – – – – – – –
Other investments 263 – 2 543 – 85 723
1 Including the net cost of property, plant and equipment of entities consolidated for the first time (excluding the ICL Group)
2 Including assets under construction of € 718 million
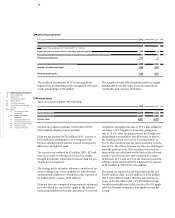
Acquisition and manufacturing cost
in € million 1. 1. 20121 Translation Additions Reclassi- Disposals 31. 12 .
differences fications 2012
Development costs 8,393 – 1,089 – 994 8,488
Goodwill 374 – – – – 374
Other intangible assets 1,040 – 3 123 3 156 1,007
Intangible assets 9,807 – 3 1,212 3 1,150 9,869
Land, titles to land, buildings, including buildings on
third party land 7,776 – 26 366 74 24 8,166
Plant and machinery 25,625 – 24 1,311 407 517 26,802
Other facilities, factory and office equipment 2,170 – 11 218 21 86 2,312
Advance payments made and construction in progress
992 – 8 2,133 – 504 8 2,605
Property, plant and equipment 36,563 – 69 4,028 – 2 635 39,885
Leased products 31,956 – 74 13,297 – 1 11,883 33,295
Investments accounted for using the equity method
302 – 350 – 13 125 514
Investments in non-consolidated subsidiaries 221 – 1 89 13 117 205
Participations 501 – 70 – – 571
Non-current marketable securities – – – – – –
Other investments 722 – 1 159 13 117 776
1 Including impact of first-time consolidations
2 Including assets under construction of € 2,205 million