BMW 2012 Annual Report Download - page 179
Download and view the complete annual report
Please find page 179 of the 2012 BMW annual report below. You can navigate through the pages in the report by either clicking on the pages listed below, or by using the keyword search tool below to find specific information within the annual report.-
 1
1 -
2
-
3
-
4
-
5
-
6
-
7
-
8
-
9
-
10
-
11
-
12
-
13
-
14
-
15
-
16
-
17
-
18
-
19
-
20
-
21
-
22
-
23
-
24
-
25
-
26
-
27
-
28
-
29
-
30
-
31
-
32
-
33
-
34
-
35
-
36
-
37
-
38
-
39
-
40
-
41
-
42
-
43
-
44
-
45
-
46
-
47
-
48
-
49
-
50
-
51
-
52
-
53
-
54
-
55
-
56
-
57
-
58
-
59
-
60
-
61
-
62
-
63
-
64
-
65
-
66
-
67
-
68
-
69
-
70
-
71
-
72
-
73
-
74
-
75
-
76
-
77
-
78
-
79
-
80
-
81
-
82
-
83
-
84
-
85
-
86
-
87
-
88
-
89
-
90
-
91
-
92
-
93
-
94
-
95
-
96
-
97
-
98
-
99
-
100
-
101
-
102
-
103
-
104
-
105
-
106
-
107
-
108
-
109
-
110
-
111
-
112
-
113
-
114
-
115
-
116
-
117
-
118
-
119
-
120
-
121
-
122
-
123
-
124
-
125
-
126
-
127
-
128
-
129
-
130
-
131
-
132
-
133
-
134
-
135
-
136
-
137
-
138
-
139
-
140
-
141
-
142
-
143
-
144
-
145
-
146
-
147
-
148
-
149
-
150
-
151
-
152
-
153
-
154
-
155
-
156
-
157
-
158
-
159
-
160
-
161
-
162
-
163
-
164
-
165
-
166
-
167
-
168
-
 169
169 -
 170
170 -
 171
171 -
 172
172 -
 173
173 -
 174
174 -
 175
175 -
 176
176 -
 177
177 -
 178
178 -
 179
179 -
 180
180 -
 181
181 -
 182
182 -
 183
183 -
 184
184 -
 185
185 -
 186
186 -
 187
187 -
 188
188 -
 189
189 -
190
-
191
-
192
-
193
-
194
-
195
-
196
-
197
-
198
-
199
-
200
-
201
-
202
-
203
-
204
-
205
-
206
-
207
-
208
-
209
-
210
-
211
-
212
-
213
-
214
-
215
-
216
-
217
-
218
-
219
-
220
-
221
-
222
-
223
-
224
-
225
-
226
-
227
-
228
-
229
-
230
-
231
-
232
-
233
-
234
-
235
-
236
-
237
-
238
-
239
-
240
-
241
-
242
-
243
-
244
-
245
-
246
-
247
-
248
-
249
-
250
-
251
-
252
-
253
-
254
-
255
-
256
-
257
-
258
-
259
-
260
-
261
-
262
-
263
-
264
-
265
-
266
-
267
-
268
-
269
-
270
-
271
-
272
-
273
-
274
-
275
-
276
-
277
-
278
-
279
-
280
-
281
-
282
-
283
-
284
 |
 |

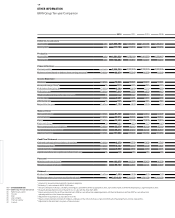
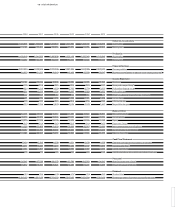
179 OTHER INFORMATION
2008 2007 2006 2005 20041 2003
Deliveries to customers
1,435,876 1,500,678 1,373,970 1,327,992 1,208,732 1,104,916 Automobiles
115,196 102,467 100,064 97,474 92,266 92,962 Motorcycles2
Production
1,439,918 1,541,503 1,366,838 1,323,119 1,250,345 1,118,940 Automobiles
118,452 104,396 103,759 92,012 93,836 89,745 Motorcycles
Financial Services
3,031,935 2,629,949 2,270,528 2,087,368 1,843,399 1,623,425 Contract portfolio
60,653 51,257 44,010 40,428 32,556 28,647
Business volume (based on balance sheet carrying amounts)3
Income Statement
53,197 56,018 48,999 46,656 44,335 41,525 Revenues
11.4 21.8 23.1 22.9 23.2 22.7 Gross profit margin Group4
921 4,212 4,050 3,793 3,774 3,353 Profit before financial result
351 3,873 4,124 3,287 3,583 3,205 Profit before tax
0.7 6.9 8.4 7.0 8.1 7.7 Return on sales (earnings before tax / revenues)
21 739 1,250 1,048 1,341 1,258 Income taxes
6.0 19.1 30.3 31.9 37.4 39.3 Effective tax rate
330 3,134 2,874 2,239 2,242 1,947 Net profit for the year
Balance Sheet
62,416 56,619 50,514 47,556 40,822 36,921 Non-current assets
38,670 32,378 28,543 27,010 26,812 24,554 Current assets
20,273 21,744 19,130 16,973 16,534 16,150 Equity
20.1 24.4 24.2 22.8 24.4 26.3 Equity ratio Group
41,526 33,469 31,372 29,509 26,517 22,090 Non-current provisions and liabilities
39,287 33,784 28,555 28,084 24,583 23,235 Current provisions and liabilities
101,086 88,997 79,057 74,566 67,634 61,475 Balance sheet total
Cash Flow Statement
7,454 2,393 1,336 1,621 2,128 1,659 Cash and cash equivalents at balance sheet date
4,471 6,246 5,373 6,184 6,157 4,970 Operating cash flow 5
4,204 4,267 4,313 3,993 4,347 4,245 Capital expenditure
7.9 7.6 8.8 8.6 9.8 10.2 Capital expenditure ratio (capital expenditure / revenues)
Personnel
100,041 107,539 106,575 105,798 105,972 104,342 Workforce at the end of year7
75,612 76,704 76,621 75,238 73,241 73,499 Personnel cost per employee
Dividend
197 694 458 4198 419 392 Dividend total
0.30 / 0.32 1.06 / 1.08 0.70 / 0.72 0.64 / 0.66 0.62 / 0.64 0.58 / 0.60 Dividend per share of common stock / preferred stock