BMW 2012 Annual Report Download - page 53
Download and view the complete annual report
Please find page 53 of the 2012 BMW annual report below. You can navigate through the pages in the report by either clicking on the pages listed below, or by using the keyword search tool below to find specific information within the annual report.
53 COMBINED GROUP AND COMPANY MANAGEMENT REPORT
sion
and rejuvenation of the model portfolio, dynamic
growth in Asia and the Americas and revenues of the
ICL Group (2011: consolidated with effect from 30 Sep-
tember 2011). Adjusted for exchange rate factors, the
increase was 7.1 %. Revenues from the sale of BMW,
MINI and Rolls-Royce brand cars climbed by 11.3 % on
the back of higher sales volumes. Motorcycles busi-
ness
revenues were 3.6 % up on the previous year.
Reve-
nues generated with Financial Services operations
rose by 13.8 %. Revenues attributable to “Other Entities”
amounted to € 2 million (2011: € 1 million).
Revenues generated by the BMW Group in the Africa,
Asia and Oceania regions increased overall by 22.7 %.
The figure includes China, where revenues jumped
by 24.6 % thanks to the growth of business on this mar-
ket. Revenues in Europe (excluding Germany) and
the Americas region grew by 9.6 % and 13.9 %
respec-
tively. By contrast, revenues generated in Germany fell
by 5.2 %.
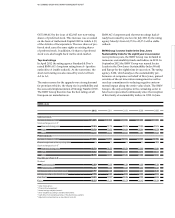
Cost of sales went up by € 7,078 million to € 61,354 mil-
lion, partly influenced by expenditure for future tech-
nologies. Gross profit improved by 6.5 % to € 15,494 mil-
lion, giving a gross profit margin of 20.2 % (2011: 21.1 %).
The gross profit
margin
recorded by the Automotive
seg-
ment was 19.5 % (2011: 20.7 %) and that of the Motor-
cycles
segment was 17.0 % (2011: 15.9 %). The gross
profit
margin
of the Financial Services segment fell from
14.3 % to 13.1 %.
Research and development costs increased by 10.6 %
to € 3,993 million, mostly due to activities related to
the electrification of the future product range. As a
percentage of revenues, the research and development
ratio remained stable at 5.2 %. Research and develop-
ment expense includes amortisation of capi
talised
development costs amounting to € 1,130 million
(2011:
€ 1,209 million). Total research and development
ex-
penditure amounted to € 3,952 million (2011: € 3,373
million). This figure comprises research costs,
non-capi-
talised development costs, capitalised de velopment
costs and systematic amortisation of
capi talised devel-
opment costs. The research and development
ex-
penditure
ratio for 2012 was therefore 5.1 % (2011: 4.9 %).
The proportion of development costs recognised as as-
sets in 2012 was 27.6 % (2011: 28.8 %).
Selling expenses went up as a result of volume rises
and inclusion of the ICL Group for the full year. The
increase in administrative expenses was attributable
to the higher number of employees on the one hand
and increased non-personnel costs on the other. Over-
all, selling and administrative expenses rose by 13.4 %
compared to the previous year and represented 9.1 %
(2011: 9.0 %) of revenues.
Depreciation and amortisation on property, plant
and
equipment and intangible assets recorded in cost
of sales and in selling and administrative expenses
amounted to € 3,541 million (2011: € 3,646 million).
The net expense reported for other operating income
and other operating expenses amounted to € 187 mil-
lion, an improvement of € 163 million compared to
the previous year. The main reason for the change was
the lower level of allocations to provisions.
As a result of the progress made, the profit before
financial result amounted to € 8,300 million (2011:
€ 8,018 million).
The financial result was a net expense of € 481 million,
which represented an improvement of € 154 million
compared to the previous year (2011: net expense of
€ 635 million). This includes the result from equity
accounted investments totalling € 271 million (2011:
€ 162 million), comprising the Group’s share of results
from interests in the joint venture BMW Brilliance
Automotive Ltd., Shenyang, the joint ventures with
the SGL Carbon Group, the two new DriveNow enti-
ties as well as the joint venture BMW Peugeot Citroën
Electrification B.V., the Hague, up to the date of the
termination of joint venture arrangements.
Other financial result was positively impacted in 2012
by improved market values on commodity derivatives
and negatively impacted by
impairment losses on in-
vestments. Overall, other financial
result improved from
a net expense of € 617 million in 2011 to a net expense
of € 592 million in 2012.
Taking all these factors into consideration, the profit
before tax improved to € 7,819 million (2011: € 7,383 mil-
lion). The figure for the previous year included an ex-
ceptional gain of € 524 million arising on the reduction
of allowances / provisions for residual value and bad
debt risks. Business with end-of-contract leasing
vehicles gave rise to an exceptional gain of € 124 mil-
lion in 2012. The pre-tax return on sales was 10.2 %
(2011: 10.7 %).


