BMW 2012 Annual Report Download - page 122
Download and view the complete annual report
Please find page 122 of the 2012 BMW annual report below. You can navigate through the pages in the report by either clicking on the pages listed below, or by using the keyword search tool below to find specific information within the annual report.-
 1
1 -
2
-
3
-
4
-
5
-
6
-
7
-
8
-
9
-
10
-
11
-
12
-
13
-
14
-
15
-
16
-
17
-
18
-
19
-
20
-
21
-
22
-
23
-
24
-
25
-
26
-
27
-
28
-
29
-
30
-
31
-
32
-
33
-
34
-
35
-
36
-
37
-
38
-
39
-
40
-
41
-
42
-
43
-
44
-
45
-
46
-
47
-
48
-
49
-
50
-
51
-
52
-
53
-
54
-
55
-
56
-
57
-
58
-
59
-
60
-
61
-
62
-
63
-
64
-
65
-
66
-
67
-
68
-
69
-
70
-
71
-
72
-
73
-
74
-
75
-
76
-
77
-
78
-
79
-
80
-
81
-
82
-
83
-
84
-
85
-
86
-
87
-
88
-
89
-
90
-
91
-
92
-
93
-
94
-
95
-
96
-
97
-
98
-
99
-
100
-
101
-
102
-
103
-
104
-
105
-
106
-
107
-
108
-
109
-
110
-
111
-
 112
112 -
 113
113 -
 114
114 -
 115
115 -
 116
116 -
 117
117 -
 118
118 -
 119
119 -
 120
120 -
 121
121 -
 122
122 -
 123
123 -
 124
124 -
 125
125 -
 126
126 -
 127
127 -
 128
128 -
 129
129 -
 130
130 -
 131
131 -
 132
132 -
133
-
134
-
135
-
136
-
137
-
138
-
139
-
140
-
141
-
142
-
143
-
144
-
145
-
146
-
147
-
148
-
149
-
150
-
151
-
152
-
153
-
154
-
155
-
156
-
157
-
158
-
159
-
160
-
161
-
162
-
163
-
164
-
165
-
166
-
167
-
168
-
169
-
170
-
171
-
172
-
173
-
174
-
175
-
176
-
177
-
178
-
179
-
180
-
181
-
182
-
183
-
184
-
185
-
186
-
187
-
188
-
189
-
190
-
191
-
192
-
193
-
194
-
195
-
196
-
197
-
198
-
199
-
200
-
201
-
202
-
203
-
204
-
205
-
206
-
207
-
208
-
209
-
210
-
211
-
212
-
213
-
214
-
215
-
216
-
217
-
218
-
219
-
220
-
221
-
222
-
223
-
224
-
225
-
226
-
227
-
228
-
229
-
230
-
231
-
232
-
233
-
234
-
235
-
236
-
237
-
238
-
239
-
240
-
241
-
242
-
243
-
244
-
245
-
246
-
247
-
248
-
249
-
250
-
251
-
252
-
253
-
254
-
255
-
256
-
257
-
258
-
259
-
260
-
261
-
262
-
263
-
264
-
265
-
266
-
267
-
268
-
269
-
270
-
271
-
272
-
273
-
274
-
275
-
276
-
277
-
278
-
279
-
280
-
281
-
282
-
283
-
284
 |
 |

122
78 GROUP FINANCIAL STATEMENTS
78 Income Statements
78 Statement of
Comprehensive Income
80 Balance Sheets
82 Cash Flow Statements
84 Group Statement of Changes
in Equity
86 Notes
86 Accounting Principles
and Policies
100 Notes to the Income
Statement
107 Notes to the Statement
of Comprehensive Income
108
Notes to the Balance Sheet
129 Other Disclosures
145 Segment Information
The expense from reversing the discounting of pension
obligations and the income from the expected return on
plan assets are reported as part of the financial result.
All other components of pension expense are included
in the income statement under costs by function.
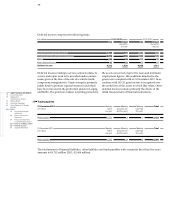
Depending on the cash flow profile and risk structure
of the pension obligations involved, pension plan assets
are invested in various investment classes, the most
predominant one being bonds. The asset portfolio also
includes equity instruments, property and alternative
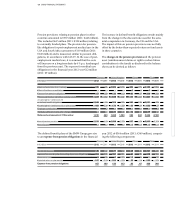
investments. The expected rate of return is derived on
the basis of the specific investment strategy applied
to each individual pension fund. This is determined on
the basis of the rates of return from the individual in-
vestment classes taking account of costs and unplanned
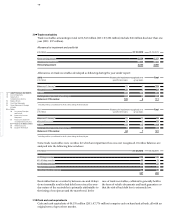
risks. This approach resulted in the following expected
rates of return on plan assets (disclosed on the basis of
weighted averages):
Germany United Kingdom Other
in % 2012 2011 2012 2011 2012 2011
Expected rate of return on plan assets 4.75 4.75 4.75 5.30 4.48 5.35
Compared to the expected return of € 529 million (2011:
€ 522 million), fund assets actually increased in the
financial year 2012 by € 1,198 million (2011: increase in
fund assets of € 485 million), giving rise to actuarial
gains on fund assets of € 669 million (2011: actuarial
losses of € 37 million). Actuarial losses on obligations
amounted to € 2,521 million in 2012 (2011: actuarial
losses of € 493 million) and related mainly to the lower
discount rates used in Germany, the UK and the USA.
At 31 December 2012, accumulated actuarial gains and
losses arising on defined benefit pension and similar
obligations and on plan assets totalled € 4,976 million
(2011: € 3,095 million).
The level of the pension obligations differs depending
on the pension system applicable in each country. Since
the state pension system in the UK only provides a low
fixed amount benefit, retirement benefits are largely
organised in the form of company pensions on the one
hand and arrangements financed by the individual on
the other. The pension benefits in the UK therefore con-
tain contributions made by the employee.
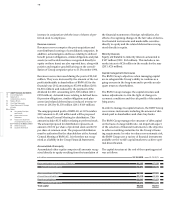
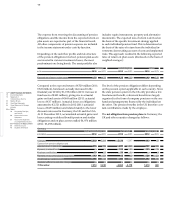
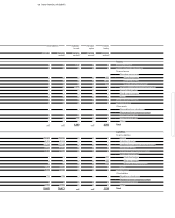
The net obligation from pension plans in Germany, the
UK and other countries changed as follows:
Germany
Defined benefit obligation Plan assets Net obligation
in € million 2012 2011 2012 2011 2012 2011
1 January 5,618 5,292 – 5,178 – 5,207 440 85
Expense from pension obligations and
expected return on plan assets 414 438 – 247 – 249 167 189
Payments to external funds – – – 153 – 32 – 153 – 32
Employee contributions 39 37 – 39 – 34 – 3
Payments on account and pension payments – 143 – 131 19 10 – 124 – 121
Actuarial gains (–) and losses (+) 2,046 – 18 – 466 334 1,580 316
Translation differences and other changes – – – – – –
31 December 7,974 5,618 – 6,064 – 5,178 1,910 440