BMW 2012 Annual Report Download - page 22
Download and view the complete annual report
Please find page 22 of the 2012 BMW annual report below. You can navigate through the pages in the report by either clicking on the pages listed below, or by using the keyword search tool below to find specific information within the annual report.-
 1
1 -
2
-
3
-
4
-
5
-
6
-
7
-
8
-
9
-
10
-
11
-
 12
12 -
 13
13 -
 14
14 -
 15
15 -
 16
16 -
 17
17 -
 18
18 -
 19
19 -
 20
20 -
 21
21 -
 22
22 -
 23
23 -
 24
24 -
 25
25 -
 26
26 -
 27
27 -
 28
28 -
 29
29 -
 30
30 -
 31
31 -
 32
32 -
33
-
34
-
35
-
36
-
37
-
38
-
39
-
40
-
41
-
42
-
43
-
44
-
45
-
46
-
47
-
48
-
49
-
50
-
51
-
52
-
53
-
54
-
55
-
56
-
57
-
58
-
59
-
60
-
61
-
62
-
63
-
64
-
65
-
66
-
67
-
68
-
69
-
70
-
71
-
72
-
73
-
74
-
75
-
76
-
77
-
78
-
79
-
80
-
81
-
82
-
83
-
84
-
85
-
86
-
87
-
88
-
89
-
90
-
91
-
92
-
93
-
94
-
95
-
96
-
97
-
98
-
99
-
100
-
101
-
102
-
103
-
104
-
105
-
106
-
107
-
108
-
109
-
110
-
111
-
112
-
113
-
114
-
115
-
116
-
117
-
118
-
119
-
120
-
121
-
122
-
123
-
124
-
125
-
126
-
127
-
128
-
129
-
130
-
131
-
132
-
133
-
134
-
135
-
136
-
137
-
138
-
139
-
140
-
141
-
142
-
143
-
144
-
145
-
146
-
147
-
148
-
149
-
150
-
151
-
152
-
153
-
154
-
155
-
156
-
157
-
158
-
159
-
160
-
161
-
162
-
163
-
164
-
165
-
166
-
167
-
168
-
169
-
170
-
171
-
172
-
173
-
174
-
175
-
176
-
177
-
178
-
179
-
180
-
181
-
182
-
183
-
184
-
185
-
186
-
187
-
188
-
189
-
190
-
191
-
192
-
193
-
194
-
195
-
196
-
197
-
198
-
199
-
200
-
201
-
202
-
203
-
204
-
205
-
206
-
207
-
208
-
209
-
210
-
211
-
212
-
213
-
214
-
215
-
216
-
217
-
218
-
219
-
220
-
221
-
222
-
223
-
224
-
225
-
226
-
227
-
228
-
229
-
230
-
231
-
232
-
233
-
234
-
235
-
236
-
237
-
238
-
239
-
240
-
241
-
242
-
243
-
244
-
245
-
246
-
247
-
248
-
249
-
250
-
251
-
252
-
253
-
254
-
255
-
256
-
257
-
258
-
259
-
260
-
261
-
262
-
263
-
264
-
265
-
266
-
267
-
268
-
269
-
270
-
271
-
272
-
273
-
274
-
275
-
276
-
277
-
278
-
279
-
280
-
281
-
282
-
283
-
284
 |
 |

22
18 COMBINED GROUP AND COMPANY
MANAGEMENT REPORT
18 A Review of the Financial Year
21 General Economic Environment
24 Review of Operations
44 BMW Stock and Capital Market
47 Disclosures relevant for takeovers
and explanatory comments
50 Financial Analysis
50 Internal Management System
52 Earnings Performance
54 Financial Position
57 Net Assets Position
59 Subsequent Events Report
59 Value Added Statement
61 Key Performance Figures
62 Comments on BMW AG
65 Internal Control System and
explanatory comments
66 Risk Management
74 Outlook
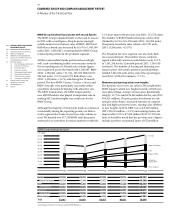
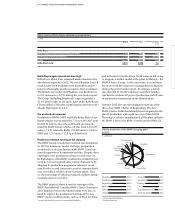
Exchange rates remain volatile, but only marginally
changed on a year-end comparison
The world’s currency markets were heavily influenced
again in 2012 by the impact of the sovereign debt crisis.
Although the US dollar exchange rate was practically
unchanged on a year-end comparison (US dollar 1.30 to
the euro), the escalation of the euro crisis in summer
2012 temporarily caused a sharp rise in the value of the
US dollar.
Since the rate of the Chinese renminbi is more or less
coupled to that of the US dollar, the volatility of the
Chinese currency generally reflects that of the US dollar
to the euro. A continuation of the gradual appreciation
of the renminbi of 1 % to 2 % was also noticeable in 2012.
The British pound increased moderately in value against
the euro and finished the year at GBP 0.81 to the euro,
thus continuing to recover from its low point during the
financial crisis. The Japanese yen fell to a rate of 114 yen
to the euro, in advance of the expansionary monetary
and fiscal policies expected to be adopted by the new
government.
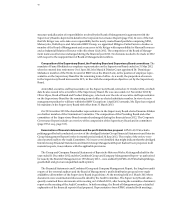
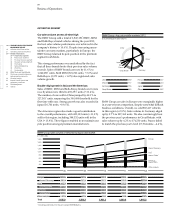
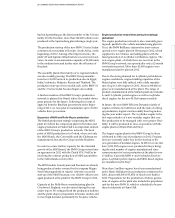
Higher prices for major raw materials
Political uncertainties regarding further developments
in various conflicts in the Middle East kept the price
of Brent oil – the most relevant for Europe – at a high
level, namely US dollar 112 per barrel on average for the
year. By contrast, the price of WTI oil – the most relevant
parameter for the USA – was somewhat lower in 2012
(average price of US dollar 94 per barrel). The upshot
was a further rise in energy prices, particularly in Europe.
By contrast, the price of steel decreased worldwide, re-
flecting the economic downturn. Prices of non-ferrous
and precious metals continued to be highly volatile,
generally in an upward direction.
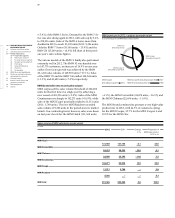
Car markets in 2012
The number of passenger cars and light commercial ve-
hicles sold worldwide rose to 72.6 million units (+ 5.7 %)
in 2012, primarily on the back of increased demand in
the USA and China. This time, however, demand in the
USA provided the strongest momentum, with the mar-
ket growing by 13.4 % to 14.5 million units. After a pe-
riod of exceptionally rapid growth in China, including
several years of double-digit growth, the passenger car
market expanded by a relatively moderate 9.4 % in 2012
to approximately 13.3 million units.
In Europe, the number of new registrations fell once
again in 2012 (12.5 million units; – 7.8 %). The decrease
in Germany was less pronounced, with new registra-
tions down by 2.9 % to approximately 3.1 million units.
Steel price trend
(Index: January 2008 = 100)
170
160
150
140
130
120
110
100
90
80
08 09 10 11 12
Source: Working Group for the Iron and Metal Processing Industry
Oil price trend
Price per barrel of Brent Crude
140
120
100
80
60
40
20
08 09 10 11 12
Source: Reuters
Price in €
Price in US Dollar