BMW 2012 Annual Report Download - page 109
Download and view the complete annual report
Please find page 109 of the 2012 BMW annual report below. You can navigate through the pages in the report by either clicking on the pages listed below, or by using the keyword search tool below to find specific information within the annual report.-
 1
1 -
2
-
3
-
4
-
5
-
6
-
7
-
8
-
9
-
10
-
11
-
12
-
13
-
14
-
15
-
16
-
17
-
18
-
19
-
20
-
21
-
22
-
23
-
24
-
25
-
26
-
27
-
28
-
29
-
30
-
31
-
32
-
33
-
34
-
35
-
36
-
37
-
38
-
39
-
40
-
41
-
42
-
43
-
44
-
45
-
46
-
47
-
48
-
49
-
50
-
51
-
52
-
53
-
54
-
55
-
56
-
57
-
58
-
59
-
60
-
61
-
62
-
63
-
64
-
65
-
66
-
67
-
68
-
69
-
70
-
71
-
72
-
73
-
74
-
75
-
76
-
77
-
78
-
79
-
80
-
81
-
82
-
83
-
84
-
85
-
86
-
87
-
88
-
89
-
90
-
91
-
92
-
93
-
94
-
95
-
96
-
97
-
98
-
 99
99 -
 100
100 -
 101
101 -
 102
102 -
 103
103 -
 104
104 -
 105
105 -
 106
106 -
 107
107 -
 108
108 -
 109
109 -
 110
110 -
 111
111 -
 112
112 -
 113
113 -
 114
114 -
 115
115 -
 116
116 -
 117
117 -
 118
118 -
 119
119 -
120
-
121
-
122
-
123
-
124
-
125
-
126
-
127
-
128
-
129
-
130
-
131
-
132
-
133
-
134
-
135
-
136
-
137
-
138
-
139
-
140
-
141
-
142
-
143
-
144
-
145
-
146
-
147
-
148
-
149
-
150
-
151
-
152
-
153
-
154
-
155
-
156
-
157
-
158
-
159
-
160
-
161
-
162
-
163
-
164
-
165
-
166
-
167
-
168
-
169
-
170
-
171
-
172
-
173
-
174
-
175
-
176
-
177
-
178
-
179
-
180
-
181
-
182
-
183
-
184
-
185
-
186
-
187
-
188
-
189
-
190
-
191
-
192
-
193
-
194
-
195
-
196
-
197
-
198
-
199
-
200
-
201
-
202
-
203
-
204
-
205
-
206
-
207
-
208
-
209
-
210
-
211
-
212
-
213
-
214
-
215
-
216
-
217
-
218
-
219
-
220
-
221
-
222
-
223
-
224
-
225
-
226
-
227
-
228
-
229
-
230
-
231
-
232
-
233
-
234
-
235
-
236
-
237
-
238
-
239
-
240
-
241
-
242
-
243
-
244
-
245
-
246
-
247
-
248
-
249
-
250
-
251
-
252
-
253
-
254
-
255
-
256
-
257
-
258
-
259
-
260
-
261
-
262
-
263
-
264
-
265
-
266
-
267
-
268
-
269
-
270
-
271
-
272
-
273
-
274
-
275
-
276
-
277
-
278
-
279
-
280
-
281
-
282
-
283
-
284
 |
 |
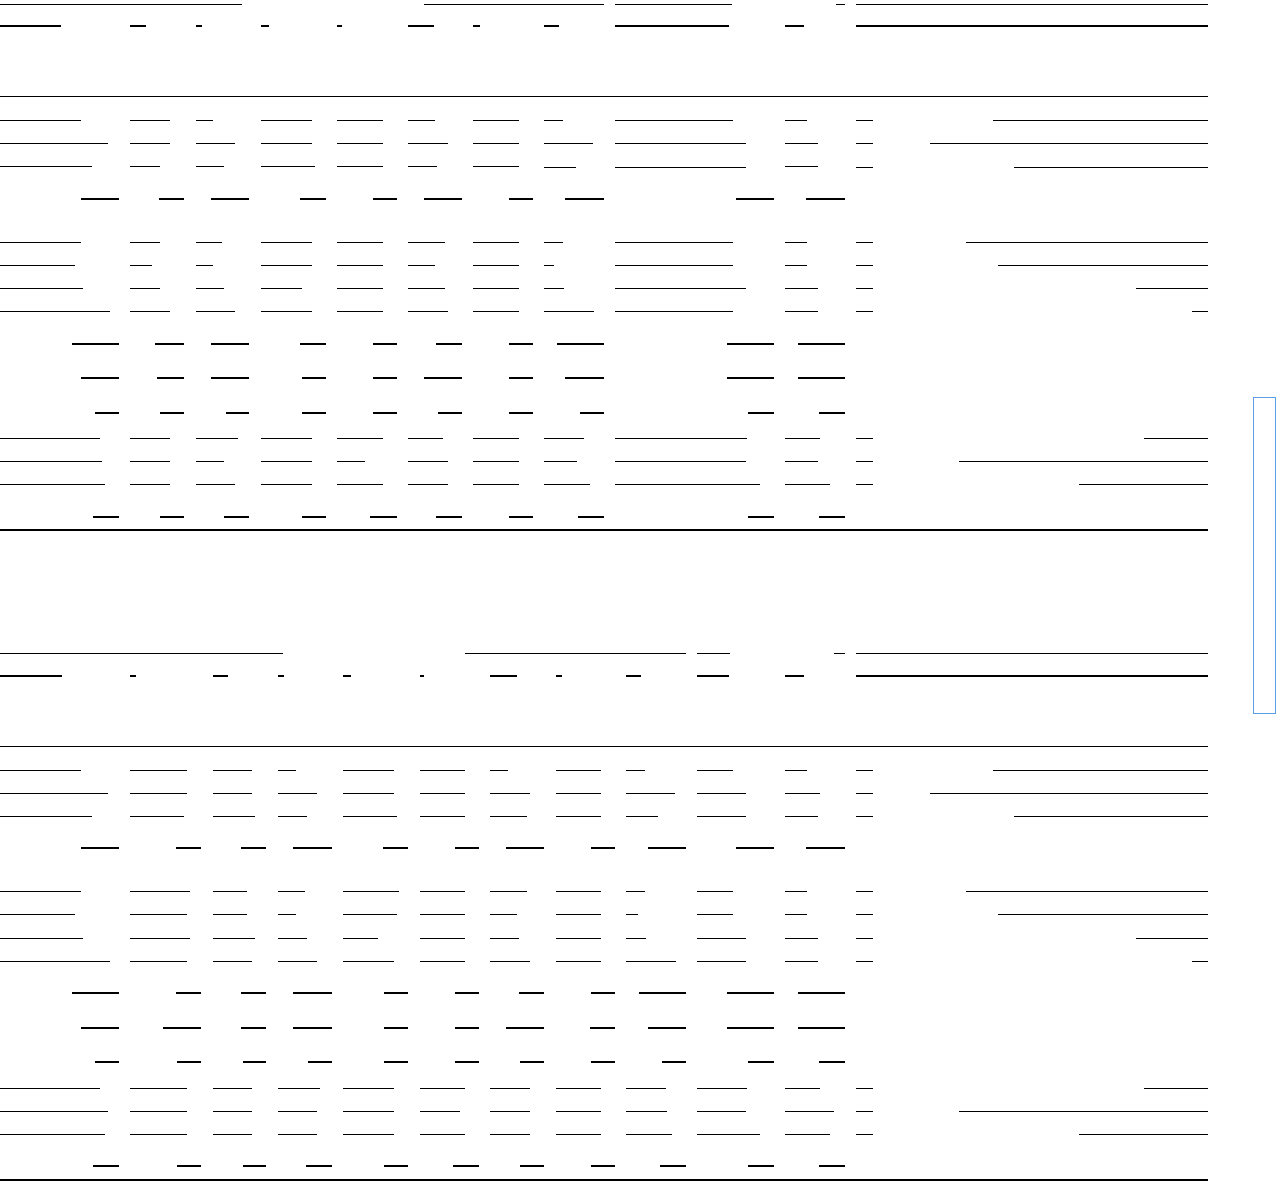
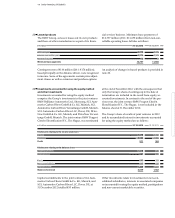
109 GROUP FINANCIAL STATEMENTS
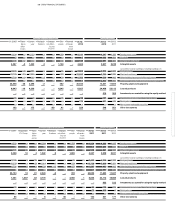
Depreciation and amortisation Carrying amount
1. 1. 2011
Acquisition
Trans- Current Reclassi-
Changes
Dis- Reversal 31. 12. 31. 12 . 31. 12 .
ICL Group lation year fications
not effect-
posals of impair- 2011 2011 2010
differ-
ing
net
ment
ences income
losses
4,522 – – 1,209 – – 1,727 – 4,004 4,388 4,625 Development costs
5 – – – – – – – 5 369 111 Goodwill
501 10 4 113 8 – 78 – 558 481 295 Other intangible assets
5,028 10 4 1,322 8 – 1,805 – 4,567 5,238 5,031 Intangible assets
Land, titles to land, buildings, including buildings on
3,186 4 20 224 1 – 12 – 3,423 4,335 4,385 third party land
18,235 – 62 1,961 4 – 533 – 19,729 5,896 5,931 Plant and machinery
1,731 8 9 139 – 13 – 177 – 1,697 463 412 Other facilities, factory and office equipment
1 – – – – – – – 1 9912 699
Advance payments made and construction in progress
23,153 12 91 2,324 – 8 – 722 – 24,850 11,685 11,427 Property, plant and equipment
7,361 1,687 83 3,770 – – 4,056 1 8,844 23,112 19,088 Leased products
– – – – – – – – – 302 212
Investments accounted for using the equity method
82 – – 8 – – – – 90 132 169 Investments in non-consolidated subsidiaries
4 – – – – 68 – – 72 429 8 Participations
– – – – – – – – – – – Non-current marketable securities
86 – – 8 – 68 – – 162 561 177 Other investments
Depreciation and amortisation Carrying amount
1. 1. 20121 Trans- Current Reclassi-
Changes
Dis- Reversal 31. 12. 31. 12 . 31. 12 .
lation year fications
not effect-
posals of impair- 2012 2012 2011
differ-
ing
net
ment
ences income
losses
4,004 – 1,130 – – 993 – 4,141 4,347 4,388 Development costs
5 – – – – – – 5 369 369 Goodwill
558 – 2 113 2 – 155 – 516 491 481 Other intangible assets
4,567 – 2 1,243 2 – 1,148 – 4,662 5,207 5,238 Intangible assets
Land, titles to land, buildings, including buildings on
3,433 – 9 251 – – 11 – 3,664 4,502 4,335 third party land
19,728 – 20 1,886 – – 497 – 21,097 5,705 5,896 Plant and machinery
1,706 – 9 161 – 2 – 74 – 1,782 530 463 Other facilities, factory and office equipment
1 – – – – – – 1 2,6042 991
Advance payments made and construction in progress
24,868 – 38 2,298 – 2 – 582 – 26,544 13,341 11,685 Property, plant and equipment
8,843 – 10 4,239 – – 4,245 – 8,827 24,468 23,112 Leased products
– – – – – – – – 514 302
Investments accounted for using the equity method
90 – 9 – – 41 – 58 147 132 Investments in non-consolidated subsidiaries
72 – 166 – – 68 – – 170 401 429 Participations
– – – – – – – – – – Non-current marketable securities
162 – 175 – – 68 41 – 228 548 561 Other investments