BMW 2012 Annual Report Download - page 50
Download and view the complete annual report
Please find page 50 of the 2012 BMW annual report below. You can navigate through the pages in the report by either clicking on the pages listed below, or by using the keyword search tool below to find specific information within the annual report.-
 1
1 -
2
-
3
-
4
-
5
-
6
-
7
-
8
-
9
-
10
-
11
-
12
-
13
-
14
-
15
-
16
-
17
-
18
-
19
-
20
-
21
-
22
-
23
-
24
-
25
-
26
-
27
-
28
-
29
-
30
-
31
-
32
-
33
-
34
-
35
-
36
-
37
-
38
-
39
-
 40
40 -
 41
41 -
 42
42 -
 43
43 -
 44
44 -
 45
45 -
 46
46 -
 47
47 -
 48
48 -
 49
49 -
 50
50 -
 51
51 -
 52
52 -
 53
53 -
 54
54 -
 55
55 -
 56
56 -
 57
57 -
 58
58 -
 59
59 -
 60
60 -
61
-
62
-
63
-
64
-
65
-
66
-
67
-
68
-
69
-
70
-
71
-
72
-
73
-
74
-
75
-
76
-
77
-
78
-
79
-
80
-
81
-
82
-
83
-
84
-
85
-
86
-
87
-
88
-
89
-
90
-
91
-
92
-
93
-
94
-
95
-
96
-
97
-
98
-
99
-
100
-
101
-
102
-
103
-
104
-
105
-
106
-
107
-
108
-
109
-
110
-
111
-
112
-
113
-
114
-
115
-
116
-
117
-
118
-
119
-
120
-
121
-
122
-
123
-
124
-
125
-
126
-
127
-
128
-
129
-
130
-
131
-
132
-
133
-
134
-
135
-
136
-
137
-
138
-
139
-
140
-
141
-
142
-
143
-
144
-
145
-
146
-
147
-
148
-
149
-
150
-
151
-
152
-
153
-
154
-
155
-
156
-
157
-
158
-
159
-
160
-
161
-
162
-
163
-
164
-
165
-
166
-
167
-
168
-
169
-
170
-
171
-
172
-
173
-
174
-
175
-
176
-
177
-
178
-
179
-
180
-
181
-
182
-
183
-
184
-
185
-
186
-
187
-
188
-
189
-
190
-
191
-
192
-
193
-
194
-
195
-
196
-
197
-
198
-
199
-
200
-
201
-
202
-
203
-
204
-
205
-
206
-
207
-
208
-
209
-
210
-
211
-
212
-
213
-
214
-
215
-
216
-
217
-
218
-
219
-
220
-
221
-
222
-
223
-
224
-
225
-
226
-
227
-
228
-
229
-
230
-
231
-
232
-
233
-
234
-
235
-
236
-
237
-
238
-
239
-
240
-
241
-
242
-
243
-
244
-
245
-
246
-
247
-
248
-
249
-
250
-
251
-
252
-
253
-
254
-
255
-
256
-
257
-
258
-
259
-
260
-
261
-
262
-
263
-
264
-
265
-
266
-
267
-
268
-
269
-
270
-
271
-
272
-
273
-
274
-
275
-
276
-
277
-
278
-
279
-
280
-
281
-
282
-
283
-
284
 |
 |

50
18 COMBINED GROUP AND COMPANY
MANAGEMENT REPORT
18 A Review of the Financial Year
21 General Economic Environment
24 Review of Operations
44 BMW Stock and Capital Market
47 Disclosures relevant for takeovers
and explanatory comments
50 Financial Analysis
50 Internal Management System
52 Earnings Performance
54 Financial Position
57 Net Assets Position
59 Subsequent Events Report
59 Value Added Statement
61 Key Performance Figures
62 Comments on BMW AG
65 Internal Control System and
explanatory comments
66 Risk Management
74 Outlook
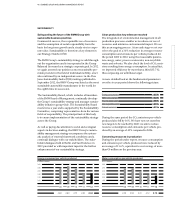
Analysis of the Group Financial Statements
Group Internal Management System
Taking into account the interests and expectations of
capital providers is an important aspect of value-based
management within the BMW Group. Only companies
generating profits on a sustainable basis that exceed the
cost of equity and debt capital employed are capable of
ensuring long-term growth, an increase in value for capi-
tal providers, jobs and, ultimately, corporate autonomy.
The BMW Group’s internal management system is
multi-
layered. The principal key financial performance indica-
tor at Group level is value added. Business is managed
at segment level on the basis of segment-specific rates of
return. The system is complemented by value-based
and return-based performance indicators measured in
conjunction with project decisions.
Capital employed comprises Group equity, the financial
liabilities of the Automotive and Motorcycles segments
and pension provisions. Value added is determined on
the basis of the average level of capital employed for a
particular year, measured as the average capital employed
at the beginning of the year, at quarter-ends and at the
end of the year.
In line with employed capital, earnings for RoCE pur-
poses corresponds to Group earnings before tax and
interest expense incurred in conjunction with the pen-
sion provision and on the financial liabilities of the
Automotive and Motorcycles segments (earnings before
interest and taxes).
The cost of capital rate is the minimum rate of return
expected by capital providers in return for the capital
employed by the Group. Since capital employed com-
prises an equity capital element (e. g. share capital) and
a debt capital element (e. g. bonds), the overall cost of
capital rate is determined on the basis of the weighted
average rates for equity and debt capital.
The cost of equity capital corresponds to the minimum
rate of return expected by an equity capital provider
investing in BMW stock. This minimum rate of return
Value added as top-level key financial
performance indicator
Value added reflects the amount of earnings over and
above the cost of capital, and gives an indication of
whether the Group is meeting the minimum require-
ments for the rate of return expected by capital
pro-
viders. A positive value added means that a company is
creating more additional value than the cost of capital
and it is therefore an important measure of financial
success.
Value added Group = earnings amount – cost of capital
= earnings amount – (cost of capital rate ×
capital employed)
is determined using the Capital Asset Pricing Model
(CAPM) and corresponds to the interest rate on long-
term, risk-free securities (e. g. German federal bonds)
plus a risk premium for the specific risk involved in in-
vesting in BMW AG.
The cost of debt capital is calculated on the basis of the
average interest rates relevant for long-term financial
liabilities and pension obligations.
For the purposes of measuring the average cost of capi-
tal rate, equity and debt cost rates are weighted on the
basis of a notional ratio derived from fixed, targeted
market values for equity and debt capital. Stability in
managing the business over time is ensured by keeping
the cost of capital rate within a pre-defined range and
by refraining from revising it unless there have been
significant
changes in circumstances.
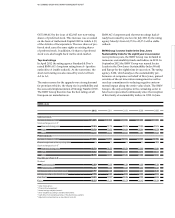
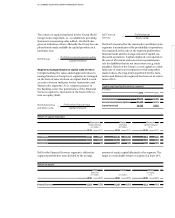
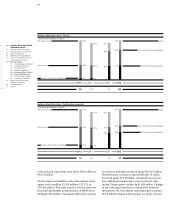
Cost of capital rate (before tax)
in %
2012 2011
BMW Group 12 12
in € million Earnings amount Cost of capital (EC + DC) Value added Group
2012 2011 2012 2011 2012 2011
BMW Group 8,128 7,637 4,221 3,575 3,907 4,062