BMW 2012 Annual Report Download - page 82
Download and view the complete annual report
Please find page 82 of the 2012 BMW annual report below. You can navigate through the pages in the report by either clicking on the pages listed below, or by using the keyword search tool below to find specific information within the annual report.-
 1
1 -
2
-
3
-
4
-
5
-
6
-
7
-
8
-
9
-
10
-
11
-
12
-
13
-
14
-
15
-
16
-
17
-
18
-
19
-
20
-
21
-
22
-
23
-
24
-
25
-
26
-
27
-
28
-
29
-
30
-
31
-
32
-
33
-
34
-
35
-
36
-
37
-
38
-
39
-
40
-
41
-
42
-
43
-
44
-
45
-
46
-
47
-
48
-
49
-
50
-
51
-
52
-
53
-
54
-
55
-
56
-
57
-
58
-
59
-
60
-
61
-
62
-
63
-
64
-
65
-
66
-
67
-
68
-
69
-
70
-
71
-
 72
72 -
 73
73 -
 74
74 -
 75
75 -
 76
76 -
 77
77 -
 78
78 -
 79
79 -
 80
80 -
 81
81 -
 82
82 -
 83
83 -
 84
84 -
 85
85 -
 86
86 -
 87
87 -
 88
88 -
 89
89 -
 90
90 -
 91
91 -
 92
92 -
93
-
94
-
95
-
96
-
97
-
98
-
99
-
100
-
101
-
102
-
103
-
104
-
105
-
106
-
107
-
108
-
109
-
110
-
111
-
112
-
113
-
114
-
115
-
116
-
117
-
118
-
119
-
120
-
121
-
122
-
123
-
124
-
125
-
126
-
127
-
128
-
129
-
130
-
131
-
132
-
133
-
134
-
135
-
136
-
137
-
138
-
139
-
140
-
141
-
142
-
143
-
144
-
145
-
146
-
147
-
148
-
149
-
150
-
151
-
152
-
153
-
154
-
155
-
156
-
157
-
158
-
159
-
160
-
161
-
162
-
163
-
164
-
165
-
166
-
167
-
168
-
169
-
170
-
171
-
172
-
173
-
174
-
175
-
176
-
177
-
178
-
179
-
180
-
181
-
182
-
183
-
184
-
185
-
186
-
187
-
188
-
189
-
190
-
191
-
192
-
193
-
194
-
195
-
196
-
197
-
198
-
199
-
200
-
201
-
202
-
203
-
204
-
205
-
206
-
207
-
208
-
209
-
210
-
211
-
212
-
213
-
214
-
215
-
216
-
217
-
218
-
219
-
220
-
221
-
222
-
223
-
224
-
225
-
226
-
227
-
228
-
229
-
230
-
231
-
232
-
233
-
234
-
235
-
236
-
237
-
238
-
239
-
240
-
241
-
242
-
243
-
244
-
245
-
246
-
247
-
248
-
249
-
250
-
251
-
252
-
253
-
254
-
255
-
256
-
257
-
258
-
259
-
260
-
261
-
262
-
263
-
264
-
265
-
266
-
267
-
268
-
269
-
270
-
271
-
272
-
273
-
274
-
275
-
276
-
277
-
278
-
279
-
280
-
281
-
282
-
283
-
284
 |
 |

82
78 GROUP FINANCIAL STATEMENTS
78 Income Statements
78 Statement of
Comprehensive Income
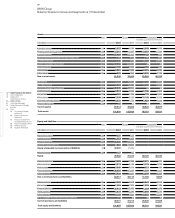
80 Balance Sheets
82 Cash Flow Statements
84 Group Statement of Changes
in Equity
86 Notes
86 Accounting Principles
and Policies
100 Notes to the Income
Statement
107 Notes to the Statement
of Comprehensive Income
108
Notes to the Balance Sheet
129 Other Disclosures
145 Segment Information
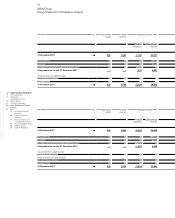
BMW Group
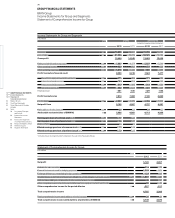
Cash Flow Statements for Group and Segments
Note Group
in € million 2012 2011
Net profit 5,122 4,907
Reconciliation between net profit and cash inflow / outflow from operating activities
Current tax 2,908 2,868
Other interest and similar income / expenses – 4 1
Depreciation and amortisation of other tangible, intangible and investment assets 3,716 3,654
Change in provisions 446 779
Change in leased products – 1,421 – 379
Change in receivables from sales financing – 3,988 – 2,837
Change in deferred taxes – 211 – 338
Other non-cash income and expense items 407 148
Gain / loss on disposal of tangible and intangible assets and marketable securities – 16 –
Result from equity accounted investments – 271 – 162
Changes in working capital 1,755 – 1,615
Change in inventories – 108 – 1,715
Change in trade receivables 744 – 800
Change in trade payables 1,119 900
Change in other operating assets and liabilities – 1,084 1,175
Income taxes paid – 2,462 – 2,701
Interest received 179 213
Cash inflow / outflow from operating activities 42
5,076 5,713
Investment in intangible assets and property, plant and equipment – 5,236 – 3,679
Proceeds from the disposal of intangible assets and property, plant and equipment 42 53
Expenditure for investments – 171 – 543
Net cash in acquiring ICL Group – – 595
Proceeds from the disposal of investments 107 21
Cash payments for the purchase of marketable securities – 1,265 – 2,073
Cash proceeds from the sale of marketable securities 1,090 1,317
Cash inflow / outflow from investing activities 42
– 5,433 – 5,499
Issue / Buy-back of treasury shares – –
Payments into equity 19 16
Payment of dividend for the previous year – 1,516 – 852
Intragroup financing and equity transactions – –
Interest paid – 102 – 82
Proceeds from the issue of bonds 7,977 5,899
Repayment of bonds – 6,727 – 5,333
Change in other financial liabilities 2,159 191
Change in commercial paper – 858 248
Cash inflow / outf low from financing activities 42
952 87
Effect of exchange rate on cash and cash equivalents – 14 – 13
Effect of changes in composition of Group on cash and cash equivalents 42
13 56
Change in cash and cash equivalents 594 344
Cash and cash equivalents as at 1 January 7,776 7,432
Cash and cash equivalents as at 31 December 42
8,370 7,776
1 Adjusted for reclassifications as described in note 42.
2 Interest relating to financial services business is classified as revenues / cost of sales.