BMW 2012 Annual Report Download - page 115
Download and view the complete annual report
Please find page 115 of the 2012 BMW annual report below. You can navigate through the pages in the report by either clicking on the pages listed below, or by using the keyword search tool below to find specific information within the annual report.-
 1
1 -
2
-
3
-
4
-
5
-
6
-
7
-
8
-
9
-
10
-
11
-
12
-
13
-
14
-
15
-
16
-
17
-
18
-
19
-
20
-
21
-
22
-
23
-
24
-
25
-
26
-
27
-
28
-
29
-
30
-
31
-
32
-
33
-
34
-
35
-
36
-
37
-
38
-
39
-
40
-
41
-
42
-
43
-
44
-
45
-
46
-
47
-
48
-
49
-
50
-
51
-
52
-
53
-
54
-
55
-
56
-
57
-
58
-
59
-
60
-
61
-
62
-
63
-
64
-
65
-
66
-
67
-
68
-
69
-
70
-
71
-
72
-
73
-
74
-
75
-
76
-
77
-
78
-
79
-
80
-
81
-
82
-
83
-
84
-
85
-
86
-
87
-
88
-
89
-
90
-
91
-
92
-
93
-
94
-
95
-
96
-
97
-
98
-
99
-
100
-
101
-
102
-
103
-
104
-
 105
105 -
 106
106 -
 107
107 -
 108
108 -
 109
109 -
 110
110 -
 111
111 -
 112
112 -
 113
113 -
 114
114 -
 115
115 -
 116
116 -
 117
117 -
 118
118 -
 119
119 -
 120
120 -
 121
121 -
 122
122 -
 123
123 -
 124
124 -
 125
125 -
126
-
127
-
128
-
129
-
130
-
131
-
132
-
133
-
134
-
135
-
136
-
137
-
138
-
139
-
140
-
141
-
142
-
143
-
144
-
145
-
146
-
147
-
148
-
149
-
150
-
151
-
152
-
153
-
154
-
155
-
156
-
157
-
158
-
159
-
160
-
161
-
162
-
163
-
164
-
165
-
166
-
167
-
168
-
169
-
170
-
171
-
172
-
173
-
174
-
175
-
176
-
177
-
178
-
179
-
180
-
181
-
182
-
183
-
184
-
185
-
186
-
187
-
188
-
189
-
190
-
191
-
192
-
193
-
194
-
195
-
196
-
197
-
198
-
199
-
200
-
201
-
202
-
203
-
204
-
205
-
206
-
207
-
208
-
209
-
210
-
211
-
212
-
213
-
214
-
215
-
216
-
217
-
218
-
219
-
220
-
221
-
222
-
223
-
224
-
225
-
226
-
227
-
228
-
229
-
230
-
231
-
232
-
233
-
234
-
235
-
236
-
237
-
238
-
239
-
240
-
241
-
242
-
243
-
244
-
245
-
246
-
247
-
248
-
249
-
250
-
251
-
252
-
253
-
254
-
255
-
256
-
257
-
258
-
259
-
260
-
261
-
262
-
263
-
264
-
265
-
266
-
267
-
268
-
269
-
270
-
271
-
272
-
273
-
274
-
275
-
276
-
277
-
278
-
279
-
280
-
281
-
282
-
283
-
284
 |
 |

115 GROUP FINANCIAL STATEMENTS
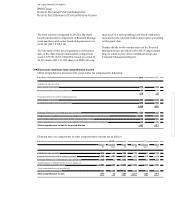
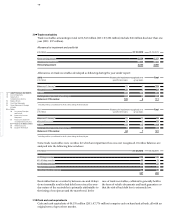
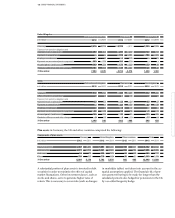
Income tax assets
Income tax assets totalling € 966 million (2011: € 1,194
mil-
lion) include claims amounting to € 638 million (2011:
€ 872 million) which are expected to be settled after more
than 12 months. Some of the claims may be settled
earlier than this depending on the timing of proceed-
ings.
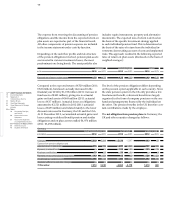
27
in € million 31. 12. 2012 31. 12. 2011
Other taxes 796 740
Receivables from subsidiaries 738 714
Receivables from other companies in which an investment is held 676 393
Prepayments 1,024 945
Collateral receivables 555 292
Sundry other assets 659 829
Other assets 4,448 3,913
thereof non-current 800 568
thereof current 3,648 3,345
28
Other assets
Other assets comprise:
Receivables from subsidiaries include trade receivables
of € 189 million (2011: € 129 million) and financial
re-
ceivables of € 549 million (2011: € 585 million). They in-
clude
€ 178 million (2011: € 116 million) with a remain-
ing term of more than one year.
Receivables from other companies in which an invest-
ment is held include € 608 million (2011: € 380 million)
due within one year.
Prepayments of € 1,024 million (2011: € 945 million) re-
late mainly to prepaid interest, insurance premiums
and commission paid to dealers. Prepayments of € 572 mil-
lion
(2011: € 609 million) have a maturity of less than
one
year.
Collateral receivables comprise mainly customary
collateral (bank deposits) arising on the sale of
receivables.
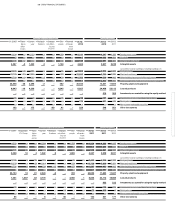
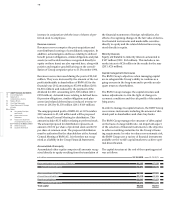
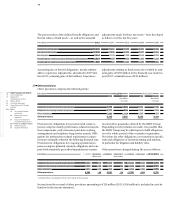
in € million 31. 12. 2012 31. 12. 2011
Raw materials and supplies 786 704
Work in progress, unbilled contracts 827 908
Finished goods and goods for resale 8,112 8,026
Inventories 9,725 9,638
29
Inventories
Inventories comprise the following:
At 31 December 2012, inventories measured at their net
realisable value amounted to € 639 million (2011: € 616 mil-
lion)
and are included in total inventories of € 9,725 mil-
lion (2011: € 9,638 million). Write-downs to net realisable
value amounting to € 21 million (2011: € 28 million)
were
recognised in 2012. There were no reversals of
write-downs in the year under report (2011: € 1 million).