BMW 2012 Annual Report Download - page 54
Download and view the complete annual report
Please find page 54 of the 2012 BMW annual report below. You can navigate through the pages in the report by either clicking on the pages listed below, or by using the keyword search tool below to find specific information within the annual report.-
 1
1 -
2
-
3
-
4
-
5
-
6
-
7
-
8
-
9
-
10
-
11
-
12
-
13
-
14
-
15
-
16
-
17
-
18
-
19
-
20
-
21
-
22
-
23
-
24
-
25
-
26
-
27
-
28
-
29
-
30
-
31
-
32
-
33
-
34
-
35
-
36
-
37
-
38
-
39
-
40
-
41
-
42
-
43
-
 44
44 -
 45
45 -
 46
46 -
 47
47 -
 48
48 -
 49
49 -
 50
50 -
 51
51 -
 52
52 -
 53
53 -
 54
54 -
 55
55 -
 56
56 -
 57
57 -
 58
58 -
 59
59 -
 60
60 -
 61
61 -
 62
62 -
 63
63 -
 64
64 -
65
-
66
-
67
-
68
-
69
-
70
-
71
-
72
-
73
-
74
-
75
-
76
-
77
-
78
-
79
-
80
-
81
-
82
-
83
-
84
-
85
-
86
-
87
-
88
-
89
-
90
-
91
-
92
-
93
-
94
-
95
-
96
-
97
-
98
-
99
-
100
-
101
-
102
-
103
-
104
-
105
-
106
-
107
-
108
-
109
-
110
-
111
-
112
-
113
-
114
-
115
-
116
-
117
-
118
-
119
-
120
-
121
-
122
-
123
-
124
-
125
-
126
-
127
-
128
-
129
-
130
-
131
-
132
-
133
-
134
-
135
-
136
-
137
-
138
-
139
-
140
-
141
-
142
-
143
-
144
-
145
-
146
-
147
-
148
-
149
-
150
-
151
-
152
-
153
-
154
-
155
-
156
-
157
-
158
-
159
-
160
-
161
-
162
-
163
-
164
-
165
-
166
-
167
-
168
-
169
-
170
-
171
-
172
-
173
-
174
-
175
-
176
-
177
-
178
-
179
-
180
-
181
-
182
-
183
-
184
-
185
-
186
-
187
-
188
-
189
-
190
-
191
-
192
-
193
-
194
-
195
-
196
-
197
-
198
-
199
-
200
-
201
-
202
-
203
-
204
-
205
-
206
-
207
-
208
-
209
-
210
-
211
-
212
-
213
-
214
-
215
-
216
-
217
-
218
-
219
-
220
-
221
-
222
-
223
-
224
-
225
-
226
-
227
-
228
-
229
-
230
-
231
-
232
-
233
-
234
-
235
-
236
-
237
-
238
-
239
-
240
-
241
-
242
-
243
-
244
-
245
-
246
-
247
-
248
-
249
-
250
-
251
-
252
-
253
-
254
-
255
-
256
-
257
-
258
-
259
-
260
-
261
-
262
-
263
-
264
-
265
-
266
-
267
-
268
-
269
-
270
-
271
-
272
-
273
-
274
-
275
-
276
-
277
-
278
-
279
-
280
-
281
-
282
-
283
-
284
 |
 |

54
18 COMBINED GROUP AND COMPANY
MANAGEMENT REPORT
18 A Review of the Financial Year
21 General Economic Environment
24 Review of Operations
44 BMW Stock and Capital Market
47 Disclosures relevant for takeovers
and explanatory comments
50 Financial Analysis
50 Internal Management System
52 Earnings Performance
54 Financial Position
57 Net Assets Position
59 Subsequent Events Report
59 Value Added Statement
61 Key Performance Figures
62 Comments on BMW AG
65 Internal Control System and
explanatory comments
66 Risk Management
74 Outlook
Income tax expense for the year totalled € 2,697 million
(2011: € 2,476 million), giving an effective tax rate of
34.5 % (2011: 33.5 %). Tax increases as a result of non-
deductible expenses relate mainly to the impact of non-
recoverable withholding taxes on intra-group dividends
and transfer price issues.
Revenues of the Automotive segment grew by 11.0 % to
€ 70,208 million (2011: € 63,229 million) due to increased
sales volumes. The strong sales volume performance
is also reflected in the profit before tax figure, which de-
spite higher personnel and non-personnel expenses,
improved from € 6,823 million in 2011 to € 7,195 million
in 2012.
In the Motorcycles segment, the number of BMW and
Husqvarna brand motorcycles sold increased by 3.1 %,
while segment revenues rose by 3.8 %. The pre-tax seg-
ment
result fell by € 35 million to € 6
million. This dete-
rioration includes the negative impact
of the planned
sale of the Husqvarna Group entities to Pierer Industrie
AG. For further information see note 32 of the Group
Financial Statements.
Financial Services segment revenues grew by 11.7 % to
€ 19,550 million. The pre-tax segment result fell by
€ 229 million to € 1,561 million (2011: € 1,790 million).
The previous year’s result included exceptional income
of € 439 million arising on the reduction of provisions
for residual value and bad debt risks. Business with
end-of-contract leasing vehicles gave rise to an excep-
tional gain of € 124 million in 2012.
The Other Entities segment recorded a pre-tax loss of
€ 6 million compared to one of € 168 million in the pre-
vious year. The main reason for the improvement in
earnings is the lower expense for allocations to provi-
sions
in 2012.
Inter-segment eliminations down to the level of profit
before tax gave rise to a net expense of € 937 million
(2011: net expense of € 1,103 million).
Financial position*
The consolidated cash flow statements for the Group
and the Automotive and Financial Services segments
show the sources and applications of cash flows for
the
financial years 2011 and 2012, classified into cash
flows from operating, investing and financing ac-
tivities.
Cash and cash equivalents in the cash flow
statements correspond to the amount disclosed in
the balance sheet.
Cash flows from operating activities are determined in-
directly, starting with Group and segment net profit.
By contrast, cash flows from investing and financial ac-
tivities are based on actual payments and receipts.
The BMW Group used various sources of funds for in-
ternal
financing purposes. In addition to the issue of
interest-bearing debt, cash funds are also allocated
in-
ternally in line with business requirements, including
the use of dividends and similar transactions. In this
context, it is possible that cash funds may be transferred
from one segment to another. Up to the first quarter
2012, these cash inflows and outflows were reported in
the Cash Flow Statements of the Automotive and Finan-
cial Services segments as part of cash flows from oper-
ating activities. Due to the increasing importance of
inter-segment transactions, the method of presentation
was changed with effect from the second quarter 2012.
Intragroup inter-segment dividends and similar
trans-
actions are now reported as part of cash flows from
financing activities. The reclassification from operating
activities to financing activities resulted in the previous
year in an increase in the operating cash flow. The pre-
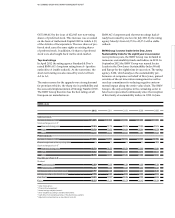
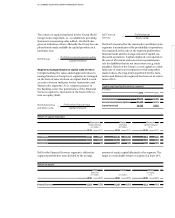
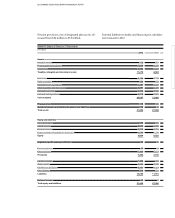
Revenues by segment
in € million
2012 2011
Automotive 70,208 63,229
Motorcycles 1,490 1,436
Financial Services 19,550 17,510
Other Entities 5 5
Eliminations – 14,405 – 13,359
Group 76,848 68,821
Profit / loss before tax by segment
in € million
2012 2011
Automotive 7,195 6,823
Motorcycles 6 41
Financial Services 1,561 1,790
Other Entities – 6 – 168
Eliminations – 937 – 1,103
Group 7,819 7,383
* Previous year’s figures adjusted