BMW 2012 Annual Report Download - page 178
Download and view the complete annual report
Please find page 178 of the 2012 BMW annual report below. You can navigate through the pages in the report by either clicking on the pages listed below, or by using the keyword search tool below to find specific information within the annual report.-
 1
1 -
2
-
3
-
4
-
5
-
6
-
7
-
8
-
9
-
10
-
11
-
12
-
13
-
14
-
15
-
16
-
17
-
18
-
19
-
20
-
21
-
22
-
23
-
24
-
25
-
26
-
27
-
28
-
29
-
30
-
31
-
32
-
33
-
34
-
35
-
36
-
37
-
38
-
39
-
40
-
41
-
42
-
43
-
44
-
45
-
46
-
47
-
48
-
49
-
50
-
51
-
52
-
53
-
54
-
55
-
56
-
57
-
58
-
59
-
60
-
61
-
62
-
63
-
64
-
65
-
66
-
67
-
68
-
69
-
70
-
71
-
72
-
73
-
74
-
75
-
76
-
77
-
78
-
79
-
80
-
81
-
82
-
83
-
84
-
85
-
86
-
87
-
88
-
89
-
90
-
91
-
92
-
93
-
94
-
95
-
96
-
97
-
98
-
99
-
100
-
101
-
102
-
103
-
104
-
105
-
106
-
107
-
108
-
109
-
110
-
111
-
112
-
113
-
114
-
115
-
116
-
117
-
118
-
119
-
120
-
121
-
122
-
123
-
124
-
125
-
126
-
127
-
128
-
129
-
130
-
131
-
132
-
133
-
134
-
135
-
136
-
137
-
138
-
139
-
140
-
141
-
142
-
143
-
144
-
145
-
146
-
147
-
148
-
149
-
150
-
151
-
152
-
153
-
154
-
155
-
156
-
157
-
158
-
159
-
160
-
161
-
162
-
163
-
164
-
165
-
166
-
167
-
 168
168 -
 169
169 -
 170
170 -
 171
171 -
 172
172 -
 173
173 -
 174
174 -
 175
175 -
 176
176 -
 177
177 -
 178
178 -
 179
179 -
 180
180 -
 181
181 -
 182
182 -
 183
183 -
 184
184 -
 185
185 -
 186
186 -
 187
187 -
 188
188 -
189
-
190
-
191
-
192
-
193
-
194
-
195
-
196
-
197
-
198
-
199
-
200
-
201
-
202
-
203
-
204
-
205
-
206
-
207
-
208
-
209
-
210
-
211
-
212
-
213
-
214
-
215
-
216
-
217
-
218
-
219
-
220
-
221
-
222
-
223
-
224
-
225
-
226
-
227
-
228
-
229
-
230
-
231
-
232
-
233
-
234
-
235
-
236
-
237
-
238
-
239
-
240
-
241
-
242
-
243
-
244
-
245
-
246
-
247
-
248
-
249
-
250
-
251
-
252
-
253
-
254
-
255
-
256
-
257
-
258
-
259
-
260
-
261
-
262
-
263
-
264
-
265
-
266
-
267
-
268
-
269
-
270
-
271
-
272
-
273
-
274
-
275
-
276
-
277
-
278
-
279
-
280
-
281
-
282
-
283
-
284
 |
 |

178
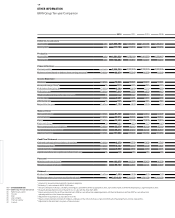
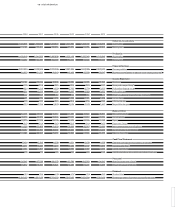
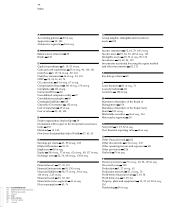
178 OTHER INFORMATION
178 BMW Group Ten-year Comparison
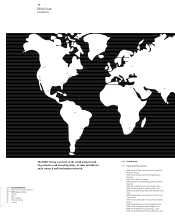
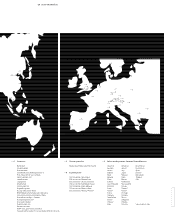
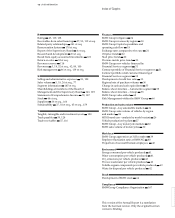
180 BMW Group Locations
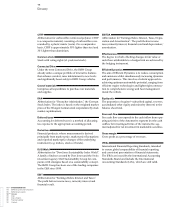
182 Glossary
184 Index
185 Index of Graphs
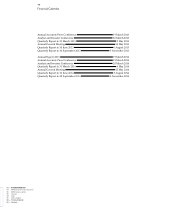
186 Financial Calendar
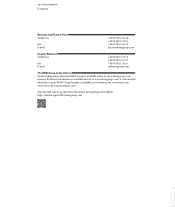
187 Contacts
2012 2011 2010 2009
Deliveries to customers
Automobiles units 1,845,186 1,668,982 1,461,166 1,286,310
Motorcycles2 units 117,109 113,572 110,113 100,358
Production
Automobiles units 1,861,826 1,738,160 1,481,253 1,258,417
Motorcycles units 125,284 118,865 112,271 93,243
Financial Services
Contract portfolio contracts 3,846,364 3,592,093 3,190,353 3,085,946
Business volume (based on balance sheet carrying amounts)3 € million 80,974 75,245 66,233 61,202
Income Statement
Revenues € million 76,848 68,821 60,477 50,681
Gross profit margin Group4 % 20.2 21.1 18.1 10.5
Profit before financial result € million 8,300 8,018 5,111 289
Profit before tax € million 7,819 7,383 4,853 413
Return on sales (earnings before tax / revenues) % 10.2 10.7 8.0 0.8
Income taxes € million 2,697 2,476 1,610 203
Effective tax rate % 34.5 33.5 33.1 49.2
Net profit for the year € million 5,122 4,907 3,243 210
Balance Sheet
Non-current assets € million 81,336 74,425 67,013 62,009
Current assets € million 50,514 49,004 43,151 39,944
Equity € million 30,402 27,103 23,930 19,915
Equity ratio Group % 23.1 22.0 21.7 19.5
Non-current provisions and liabilities € million 53,074 49,113 46,100 45,119
Current provisions and liabilities € million 48,374 47,213 40,134 36,919
Balance sheet total € million 131,850 123,429 110,164 101,953
Cash Flow Statement
Cash and cash equivalents at balance sheet date € million 8,370 7,776 7,432 7,767
Operating cash flow 5 € million 9,167 8,1106 8,149 4,921
Capital expenditure € million 5,240 3,692 3,263 3,471
Capital expenditure ratio (capital expenditure / revenues) % 6.8 5.4 5.4 6.8
Personnel
Workforce at the end of year7 105,876 100,306 95,453 96,230
Personnel cost per employee € 89,140 84,887 83,141 72,349
Dividend
Dividend total € million 1,640 1,508 852 197
Dividend per share of common stock / preferred stock € 2.50 /2.52 2.30 / 2.32 1.30 /1.32 0.30 / 0.32
1 Adjusted for new accounting treatment of pension obligations
2 Excluding C1, sales volume to 2003: 32,859 units
3 Amount computed on the basis of balance sheet figures: until 2007 from the Group balance sheet, from 2008 onwards from the Financial Services segment balance sheet
4 Research and development costs included in cost of sales with the effect from 2008
5 Figures are reported in the cash flow statement up to 2006 as cash inflow from operating activities of Industrial Operations and from 2007 as cash inflow from
operating activities of the Automotive segment.
6 Adjusted for reclassifications as described in note 42.
7 Figures exclude dormant employment contracts, employees in the non-work phases of pre-retirement part-time arrangements and low wage earners.
8 Adjustment to dividend due to buy-back of treasury shares
OTHER INFORMATION
BMW Group Ten-year Comparison