BMW 2012 Annual Report Download - page 59
Download and view the complete annual report
Please find page 59 of the 2012 BMW annual report below. You can navigate through the pages in the report by either clicking on the pages listed below, or by using the keyword search tool below to find specific information within the annual report.-
 1
1 -
2
-
3
-
4
-
5
-
6
-
7
-
8
-
9
-
10
-
11
-
12
-
13
-
14
-
15
-
16
-
17
-
18
-
19
-
20
-
21
-
22
-
23
-
24
-
25
-
26
-
27
-
28
-
29
-
30
-
31
-
32
-
33
-
34
-
35
-
36
-
37
-
38
-
39
-
40
-
41
-
42
-
43
-
44
-
45
-
46
-
47
-
48
-
 49
49 -
 50
50 -
 51
51 -
 52
52 -
 53
53 -
 54
54 -
 55
55 -
 56
56 -
 57
57 -
 58
58 -
 59
59 -
 60
60 -
 61
61 -
 62
62 -
 63
63 -
 64
64 -
 65
65 -
 66
66 -
 67
67 -
 68
68 -
 69
69 -
70
-
71
-
72
-
73
-
74
-
75
-
76
-
77
-
78
-
79
-
80
-
81
-
82
-
83
-
84
-
85
-
86
-
87
-
88
-
89
-
90
-
91
-
92
-
93
-
94
-
95
-
96
-
97
-
98
-
99
-
100
-
101
-
102
-
103
-
104
-
105
-
106
-
107
-
108
-
109
-
110
-
111
-
112
-
113
-
114
-
115
-
116
-
117
-
118
-
119
-
120
-
121
-
122
-
123
-
124
-
125
-
126
-
127
-
128
-
129
-
130
-
131
-
132
-
133
-
134
-
135
-
136
-
137
-
138
-
139
-
140
-
141
-
142
-
143
-
144
-
145
-
146
-
147
-
148
-
149
-
150
-
151
-
152
-
153
-
154
-
155
-
156
-
157
-
158
-
159
-
160
-
161
-
162
-
163
-
164
-
165
-
166
-
167
-
168
-
169
-
170
-
171
-
172
-
173
-
174
-
175
-
176
-
177
-
178
-
179
-
180
-
181
-
182
-
183
-
184
-
185
-
186
-
187
-
188
-
189
-
190
-
191
-
192
-
193
-
194
-
195
-
196
-
197
-
198
-
199
-
200
-
201
-
202
-
203
-
204
-
205
-
206
-
207
-
208
-
209
-
210
-
211
-
212
-
213
-
214
-
215
-
216
-
217
-
218
-
219
-
220
-
221
-
222
-
223
-
224
-
225
-
226
-
227
-
228
-
229
-
230
-
231
-
232
-
233
-
234
-
235
-
236
-
237
-
238
-
239
-
240
-
241
-
242
-
243
-
244
-
245
-
246
-
247
-
248
-
249
-
250
-
251
-
252
-
253
-
254
-
255
-
256
-
257
-
258
-
259
-
260
-
261
-
262
-
263
-
264
-
265
-
266
-
267
-
268
-
269
-
270
-
271
-
272
-
273
-
274
-
275
-
276
-
277
-
278
-
279
-
280
-
281
-
282
-
283
-
284
 |
 |

59 COMBINED GROUP AND COMPANY MANAGEMENT REPORT
and expenses relating to equity accounted investments
and recognised directly in equity, net of deferred tax,
increased equity by € 82 million. The dividend payment
decreased equity by € 1,508 million. Minority interests
went up by € 42 million. Other changes amounted to
€ 7 million.
A portion of the Authorised Capital created at the
Annual General Meeting held on 14 May 2009 in con-
junction with the Employee Share Scheme was used
during the financial year under report to issue shares
of preferred stock to employees, thereby increasing sub-
scribed
capital to € 656 million. An amount of € 18
mil-
lion was transferred to capital reserves in conjunction
with this share capital increase. The equity ratio of the
BMW Group improved overall by 1.1 percentage points
to 23.1 %. The equity ratio of the Automotive segment
was 40.9 % (2011: 41.1 %) and that of the Financial Ser-
vices segment was 8.6 % (2011: 8.7 %).
Pension provisions increased by 81.6 % to € 3,965 million
mainly as a result of lower discount factors used in Ger-
many, the UK and the USA. In the case of pension plans
with fund assets, the fair value of fund assets is offset
against the defined benefit obligation.
Current and non-current other provisions increased by
€ 542 million to € 6,795 million.
Current and non-current financial liabilities went up
by € 1,530 million to € 69,507 million. Within financial
liabilities, there were increases in bonds (+4.5 %), cus-
tomer deposits (banking) (+8.1 %) and liabilities to
banks (+12.9 %). By contrast, liabilities for commercial
paper decreased by € 901 million.
Trade payables amounted to € 6,433 million and were
thus 20.5 % higher than one year earlier, mainly
attributable to the expansion of business operations.
Other liabilities increased by 2.6 % to € 10,196 million.
Overall, the earnings performance, financial position
and net assets position of the BMW Group continued to
develop very positively during the financial year under
report.
Compensation report
The compensation of the Board of Management com-
prises both a fixed and a variable component. Benefits
are also payable – primarily in the form of pension
benefits – at the end of members’ mandates. Further
details, including an analysis of remuneration by each
individual, are disclosed in the Compensation Report,
which can be found in the section “Statement on
Corporate Governance”. The Compensation Report is
a sub-section of the Combined Group and Company
Management Report.
Events after the end of the reporting period
No events have occurred after the balance sheet date
which could have a major impact on the earnings
performance, financial position and net assets of the
BMW Group.
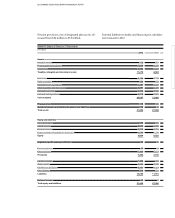
Value added statement
The value added statement shows the value of work per-
formed
less the value of work bought in by the BMW
Group during the financial year. Depreciation and
amortisation, cost of materials and other expenses are
treated as bought-in costs in the value added calcula-
tion. The allocation statement applies value added to
each of the participants involved in the value added
process. It should be noted that the gross value added
amount treats depreciation as a component of value
added which, in the allocation statement, is treated as
internal financing.
Net valued added by the BMW Group in 2012 rose by
6.8 % to € 18,975 million. The increase over the previous
year was attributable to the higher level of revenues.
The bulk of the net value added (45.0 %) is applied to em-
ployees. The proportion applied to providers of finance
fell to 10.7 %, mainly due to the lower refinancing costs
on international capital markets for the financial
ser-
vices side of the business. The government / public sector
(including deferred tax expense) accounted for 17.3 %.
The proportion of net value added applied to
share-
holders, at 8.7 %, was higher than in the previous year.
Minority interests take a 0.1 % share of net value added.
The remaining proportion of net value added (18.2 %)
will be retained in the Group to finance future operations.