ADT 2010 Annual Report Download - page 78
Download and view the complete annual report
Please find page 78 of the 2010 ADT annual report below. You can navigate through the pages in the report by either clicking on the pages listed below, or by using the keyword search tool below to find specific information within the annual report.-
 1
1 -
2
-
3
-
4
-
5
-
6
-
7
-
8
-
9
-
10
-
11
-
12
-
13
-
14
-
15
-
16
-
17
-
18
-
19
-
20
-
21
-
22
-
23
-
24
-
25
-
26
-
27
-
28
-
29
-
30
-
31
-
32
-
33
-
34
-
35
-
36
-
37
-
38
-
39
-
40
-
41
-
42
-
43
-
44
-
45
-
46
-
47
-
48
-
49
-
50
-
51
-
52
-
53
-
54
-
55
-
56
-
57
-
58
-
59
-
60
-
61
-
62
-
63
-
64
-
65
-
66
-
67
-
 68
68 -
 69
69 -
 70
70 -
 71
71 -
 72
72 -
 73
73 -
 74
74 -
 75
75 -
 76
76 -
 77
77 -
 78
78 -
 79
79 -
 80
80 -
 81
81 -
 82
82 -
 83
83 -
 84
84 -
 85
85 -
 86
86 -
 87
87 -
 88
88 -
89
-
90
-
91
-
92
-
93
-
94
-
95
-
96
-
97
-
98
-
99
-
100
-
101
-
102
-
103
-
104
-
105
-
106
-
107
-
108
-
109
-
110
-
111
-
112
-
113
-
114
-
115
-
116
-
117
-
118
-
119
-
120
-
121
-
122
-
123
-
124
-
125
-
126
-
127
-
128
-
129
-
130
-
131
-
132
-
133
-
134
-
135
-
136
-
137
-
138
-
139
-
140
-
141
-
142
-
143
-
144
-
145
-
146
-
147
-
148
-
149
-
150
-
151
-
152
-
153
-
154
-
155
-
156
-
157
-
158
-
159
-
160
-
161
-
162
-
163
-
164
-
165
-
166
-
167
-
168
-
169
-
170
-
171
-
172
-
173
-
174
-
175
-
176
-
177
-
178
-
179
-
180
-
181
-
182
-
183
-
184
-
185
-
186
-
187
-
188
-
189
-
190
-
191
-
192
-
193
-
194
-
195
-
196
-
197
-
198
-
199
-
200
-
201
-
202
-
203
-
204
-
205
-
206
-
207
-
208
-
209
-
210
-
211
-
212
-
213
-
214
-
215
-
216
-
217
-
218
-
219
-
220
-
221
-
222
-
223
-
224
-
225
-
226
-
227
-
228
-
229
-
230
-
231
-
232
-
233
-
234
-
235
-
236
-
237
-
238
-
239
-
240
-
241
-
242
-
243
-
244
-
245
-
246
-
247
-
248
-
249
-
250
-
251
-
252
-
253
-
254
-
255
-
256
-
257
-
258
-
259
-
260
-
261
-
262
-
263
-
264
-
265
-
266
-
267
-
268
-
269
-
270
-
271
-
272
-
273
-
274
-
275
-
276
-
277
-
278
-
279
-
280
-
281
-
282
-
283
-
284
-
285
-
286
-
287
-
288
-
289
-
290
-
291
-
292
 |
 |

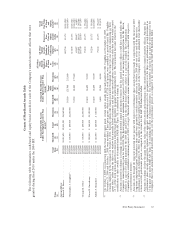
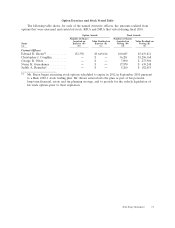
Exercise Edward D Christopher J George R Naren K Judith A
Vesting Date Price Breen Coughlin Oliver Gursahaney Reinsdorf
Number Of Shares Underlying Vesting Awards
2010
10/1/2010 .......... 33.75 112,425 79,350 23,800 23,800 19,825
10/7/2010 .......... 29.00 138,525 46,175 32,325 32,325 24,625
11/21/2010 ......... 48.14 99,929 47,211 22,032
2011
5/10/2011 .......... 51.14 11,165
7/2/2011 ........... 53.36 73,000 34,750 17,750 17,750 11,750
8/18/2011 .......... 44.49 17,500 17,500
10/1/2011 .......... 33.75 112,425 79,350 23,800 23,800 19,825
10/7/2011 .......... 29.00 138,525 46,175 32,325 32,325 24,625
2012
8/18/2012 .......... 44.49 17,500 17,500
10/1/2012 .......... 33.75 112,425 79,350 23,800 23,800 19,825
10/7/2012 .......... 29.00 138,525 46,175 32,325 32,325 24,625
2013
10/1/2013 .......... 33.75 112,425 79,350 23,800 23,800 19,825
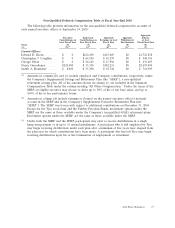
(2) The amounts in columns (f) and (g) reflect, for each named executive officer, the number and
market value of RSUs which had been granted as of September 24, 2010, but which remained
subject to additional vesting requirements (the officer’s continued employment with the Company).
Scheduled vesting of all RSUs for each of the named executive officer is as follows:
Edward D Christopher J George R Naren K Judith A
Vesting Date Breen Coughlin Oliver Gursahaney Reinsdorf
Number Of Shares Underlying Vesting Awards
2010
11/21/2010 ................. 46,825 21,470 10,279
2011
7/2/2011 ................... 33,484 15,438 7,933 7,933 5,288
2012
8/18/2012 .................. 11,839 11,839
(3) Amounts in columns (h) and (i) reflect the number and market value, as of September 24, 2010, of
performance share units that would be earned if the performance goals related to these awards
were met at the target level at the end of the performance period. If the minimum performance
threshold is not met (i.e., Tyco’s total shareholder return over the performance period is not equal
to or better than the total shareholder return of any company within the top 65% of the
companies constituting the S&P 500 Industrials Index), there will be no payout. The number of
shares that will actually be earned will depend on the Company’s three-year shareholder return as
compared to the total shareholder return of the S & P 500 Industrials Index. Scheduled vesting of
all performance share units (based on achievement of target values) for each of the named
executive officers is as follows:
Edward D Christopher J George R Naren K Judith A
Vesting Date Breen Coughlin Oliver Gursahaney Reinsdorf
Number Of Shares Underlying Vesting Awards
2011
9/30/2011 .................. 155,100 51,700 36,200 36,200 27,500
2012
9/30/2012 .................. 125,900 88,800 26,600 26,600 22,200
70 2011 Proxy Statement