ADT 2010 Annual Report Download - page 257
Download and view the complete annual report
Please find page 257 of the 2010 ADT annual report below. You can navigate through the pages in the report by either clicking on the pages listed below, or by using the keyword search tool below to find specific information within the annual report.-
 1
1 -
2
-
3
-
4
-
5
-
6
-
7
-
8
-
9
-
10
-
11
-
12
-
13
-
14
-
15
-
16
-
17
-
18
-
19
-
20
-
21
-
22
-
23
-
24
-
25
-
26
-
27
-
28
-
29
-
30
-
31
-
32
-
33
-
34
-
35
-
36
-
37
-
38
-
39
-
40
-
41
-
42
-
43
-
44
-
45
-
46
-
47
-
48
-
49
-
50
-
51
-
52
-
53
-
54
-
55
-
56
-
57
-
58
-
59
-
60
-
61
-
62
-
63
-
64
-
65
-
66
-
67
-
68
-
69
-
70
-
71
-
72
-
73
-
74
-
75
-
76
-
77
-
78
-
79
-
80
-
81
-
82
-
83
-
84
-
85
-
86
-
87
-
88
-
89
-
90
-
91
-
92
-
93
-
94
-
95
-
96
-
97
-
98
-
99
-
100
-
101
-
102
-
103
-
104
-
105
-
106
-
107
-
108
-
109
-
110
-
111
-
112
-
113
-
114
-
115
-
116
-
117
-
118
-
119
-
120
-
121
-
122
-
123
-
124
-
125
-
126
-
127
-
128
-
129
-
130
-
131
-
132
-
133
-
134
-
135
-
136
-
137
-
138
-
139
-
140
-
141
-
142
-
143
-
144
-
145
-
146
-
147
-
148
-
149
-
150
-
151
-
152
-
153
-
154
-
155
-
156
-
157
-
158
-
159
-
160
-
161
-
162
-
163
-
164
-
165
-
166
-
167
-
168
-
169
-
170
-
171
-
172
-
173
-
174
-
175
-
176
-
177
-
178
-
179
-
180
-
181
-
182
-
183
-
184
-
185
-
186
-
187
-
188
-
189
-
190
-
191
-
192
-
193
-
194
-
195
-
196
-
197
-
198
-
199
-
200
-
201
-
202
-
203
-
204
-
205
-
206
-
207
-
208
-
209
-
210
-
211
-
212
-
213
-
214
-
215
-
216
-
217
-
218
-
219
-
220
-
221
-
222
-
223
-
224
-
225
-
226
-
227
-
228
-
229
-
230
-
231
-
232
-
233
-
234
-
235
-
236
-
237
-
238
-
239
-
240
-
241
-
242
-
243
-
244
-
245
-
246
-
 247
247 -
 248
248 -
 249
249 -
 250
250 -
 251
251 -
 252
252 -
 253
253 -
 254
254 -
 255
255 -
 256
256 -
 257
257 -
 258
258 -
 259
259 -
 260
260 -
 261
261 -
 262
262 -
 263
263 -
 264
264 -
 265
265 -
 266
266 -
 267
267 -
268
-
269
-
270
-
271
-
272
-
273
-
274
-
275
-
276
-
277
-
278
-
279
-
280
-
281
-
282
-
283
-
284
-
285
-
286
-
287
-
288
-
289
-
290
-
291
-
292
 |
 |

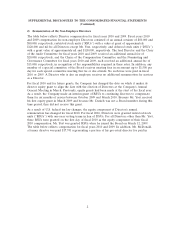
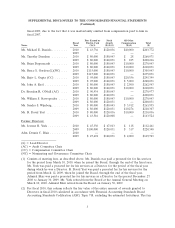
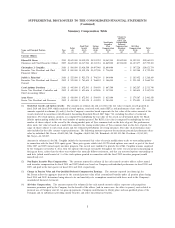
SUPPLEMENTAL DISCLOSURES TO THE CONSOLIDATED FINANCIAL STATEMENTS
(Continued)
Summary Compensation Table
Change in
Pension
Value and
Non-Equity Nonqualified
Incentive Deferred
Stock/Unit Option Plan Compensation All Other
Salary Awards Awards Compensation Earnings Compensation Total
Name and Principal Position Year ($) ($)(1) ($)(1) ($)(2) ($)(3) ($)(4) ($)
(a) (b) (c) (d) (e) (f) (g) (h) (i)
Current Officers
Edward D. Breen .............. 2010 $1,625,000 $4,419,090 $4,515,932 $4,062,500 $3,842,000 $1,399,351 $19,863,873
Chairman and Chief Executive Officer 2009 $1,625,000 $4,317,984 $4,313,724 $1,869,000 $4,542,000 $1,127,677 $17,795,385
Christopher J. Coughlin .......... 2010 $ 800,000 $3,416,580 $4,497,948 $1,600,000 — $ 307,226 $10,621,754
Executive Vice President and Chief 2009 $ 800,000 $1,439,328 $1,437,908 $ 736,000 — $ 309,188 $ 4,722,424
Financial Officer
Judith A. Reinsdorf ............ 2010 $ 525,000 $ 921,578 $ 796,339 $ 840,000 — $ 185,452 $ 3,268,369
Executive Vice President and General 2009 $ 525,000 $ 765,600 $ 766,832 $ 386,000 — $ 221,349 $ 2,664,781
Counsel
Carol Anthony Davidson ......... 2010 $ 445,000 $ 672,503 $ 584,450 $ 667,500 — $ 162,287 $ 2,531,740
Senior Vice President, Controller and 2009 $ 445,000 $ 623,616 $ 622,808 $ 307,000 — $ 188,650 $ 2,187,074
Chief Accounting Officer
Arun Nayar ................. 2010 $ 410,000 $ 672,503 $ 584,450 $ 615,000 — $ 179,367 $ 2,461,320
Senior Vice President and Treasurer 2009 $ 410,000 $ 431,520 $ 431,295 $ 283,000 — $ 274,495 $ 1,830,310
(1) Stock/Unit Awards and Option Awards: The amounts in columns (d) and (e) reflect the fair value of equity awards granted in
fiscal 2010 and fiscal 2009, which consisted of stock options, restricted stock units (RSUs) and performance share units. The
amounts reported in columns (d) and (e) for the Company’s executive board represents the fair value of the entire amount of the
award calculated in accordance with Financial Accounting Standards Board ASC Topic 718, excluding the effect of estimated
forfeitures. For stock options, amounts are computed by multiplying the fair value of the award (as determined under the Black-
Scholes option pricing model) by the total number of options granted. For RSUs, fair value is computed by multiplying the total
number of shares subject to the award by the closing market price of Tyco common stock on the date of grant. For performance
share units, fair value is based on a model that considers the closing market price of Tyco common stock on the date of grant, the
range of shares subject to such stock award, and the estimated probabilities of vesting outcomes. The value of performance share
units included in the table assumes target performance. The following amounts represent the maximum potential performance share
value by individual: Mr. Breen—$8,838,180; Mr. Coughlin—$6,833,160; Ms. Reinsdorf—$1,843,155; Mr. Davidson—$1,345,005;
Mr. Nayar—$1,345,005.
Amounts in columns (e) for Mr. Coughlin include the incremental fair value of certain modifications made to outstanding options
in connection with the fiscal 2010 equity grant. These prior grants, which total 435,728 stock options, were made as part of the fiscal
2006, 2007 and 2009 annual equity incentive program. The awards were modified to provide that if Mr. Coughlin remains employed
by the Company on October 8, 2011, then the options will remain exercisable throughout the entire ten-year period commencing on
their grant dates, rather than the three-year window that normally follows retirement, and that any unvested options outstanding on
such date (which would consist of 1⁄4 of the stock options granted in connection with the fiscal 2009 incentive program) would
immediately vest.
(2) Non-Equity Incentive Plan Compensation: The amounts reported in column (f) for each named executive officer reflect annual
cash incentive compensation for fiscal 2010 and 2009 (which was based on Company and individual performance in fiscal 2010 and
2009, and paid in the first quarter of fiscal 2011 and 2010, respectively).
(3) Change in Pension Value and Non-Qualified Deferred Compensation Earnings: The amounts reported in column (g) for
Mr. Breen reflect the aggregate increase in the actuarial present value of his accumulated benefits under all pension plans during
fiscal 2010 and 2009, determined using interest rate and mortality rate assumptions consistent with those used in the Company’s
consolidated financial statements.
(4) All Other Compensation: The amounts reported in column (h) for each named executive officer represent cash perquisites,
insurance premiums paid by the Company for the benefit of the officer (and, in some cases, the officer’s spouse), costs related to
personal use of Company aircraft, tax gross-up payments, Company contributions to 401(k) plans and non-qualified plans of the
Company and its subsidiaries providing similar benefits, and other miscellaneous benefits.
5