ADT 2010 Annual Report Download - page 241
Download and view the complete annual report
Please find page 241 of the 2010 ADT annual report below. You can navigate through the pages in the report by either clicking on the pages listed below, or by using the keyword search tool below to find specific information within the annual report.-
 1
1 -
2
-
3
-
4
-
5
-
6
-
7
-
8
-
9
-
10
-
11
-
12
-
13
-
14
-
15
-
16
-
17
-
18
-
19
-
20
-
21
-
22
-
23
-
24
-
25
-
26
-
27
-
28
-
29
-
30
-
31
-
32
-
33
-
34
-
35
-
36
-
37
-
38
-
39
-
40
-
41
-
42
-
43
-
44
-
45
-
46
-
47
-
48
-
49
-
50
-
51
-
52
-
53
-
54
-
55
-
56
-
57
-
58
-
59
-
60
-
61
-
62
-
63
-
64
-
65
-
66
-
67
-
68
-
69
-
70
-
71
-
72
-
73
-
74
-
75
-
76
-
77
-
78
-
79
-
80
-
81
-
82
-
83
-
84
-
85
-
86
-
87
-
88
-
89
-
90
-
91
-
92
-
93
-
94
-
95
-
96
-
97
-
98
-
99
-
100
-
101
-
102
-
103
-
104
-
105
-
106
-
107
-
108
-
109
-
110
-
111
-
112
-
113
-
114
-
115
-
116
-
117
-
118
-
119
-
120
-
121
-
122
-
123
-
124
-
125
-
126
-
127
-
128
-
129
-
130
-
131
-
132
-
133
-
134
-
135
-
136
-
137
-
138
-
139
-
140
-
141
-
142
-
143
-
144
-
145
-
146
-
147
-
148
-
149
-
150
-
151
-
152
-
153
-
154
-
155
-
156
-
157
-
158
-
159
-
160
-
161
-
162
-
163
-
164
-
165
-
166
-
167
-
168
-
169
-
170
-
171
-
172
-
173
-
174
-
175
-
176
-
177
-
178
-
179
-
180
-
181
-
182
-
183
-
184
-
185
-
186
-
187
-
188
-
189
-
190
-
191
-
192
-
193
-
194
-
195
-
196
-
197
-
198
-
199
-
200
-
201
-
202
-
203
-
204
-
205
-
206
-
207
-
208
-
209
-
210
-
211
-
212
-
213
-
214
-
215
-
216
-
217
-
218
-
219
-
220
-
221
-
222
-
223
-
224
-
225
-
226
-
227
-
228
-
229
-
230
-
 231
231 -
 232
232 -
 233
233 -
 234
234 -
 235
235 -
 236
236 -
 237
237 -
 238
238 -
 239
239 -
 240
240 -
 241
241 -
 242
242 -
 243
243 -
 244
244 -
 245
245 -
 246
246 -
 247
247 -
 248
248 -
 249
249 -
 250
250 -
 251
251 -
252
-
253
-
254
-
255
-
256
-
257
-
258
-
259
-
260
-
261
-
262
-
263
-
264
-
265
-
266
-
267
-
268
-
269
-
270
-
271
-
272
-
273
-
274
-
275
-
276
-
277
-
278
-
279
-
280
-
281
-
282
-
283
-
284
-
285
-
286
-
287
-
288
-
289
-
290
-
291
-
292
 |
 |

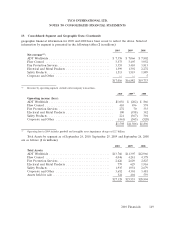
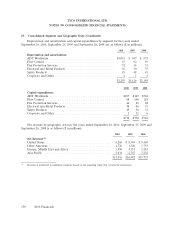
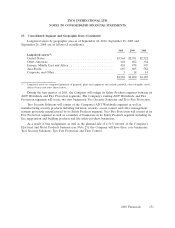
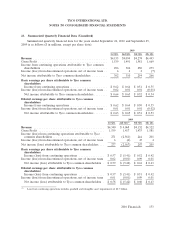
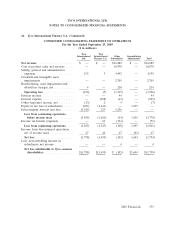
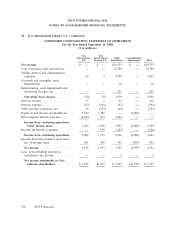
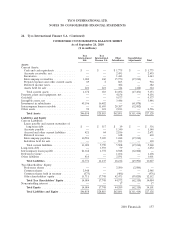
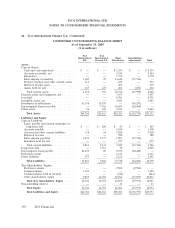
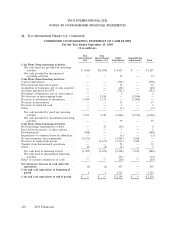
TYCO INTERNATIONAL LTD.
NOTES TO CONSOLIDATED FINANCIAL STATEMENTS
23. Summarized Quarterly Financial Data (Unaudited)
Summarized quarterly financial data for the years ended September 24, 2010 and September 25,
2009 is as follows ($ in millions, except per share data):
2010
1st Qtr. 2nd Qtr. 3rd Qtr. 4th Qtr.
Revenue ........................................... $4,155 $4,094 $4,274 $4,493
Gross Profit ........................................ 1,539 1,491 1,581 1,669
Income from continuing operations attributable to Tyco common
shareholders ...................................... 296 306 250 273
Income (loss) from discontinued operations, net of income taxes . . 6 4 4 (7)
Net income attributable to Tyco common shareholders ......... 302 310 254 266
Basic earnings per share attributable to Tyco common
shareholders:
Income from continuing operations ...................... $ 0.62 $ 0.64 $ 0.51 $ 0.55
Income (loss) from discontinued operations, net of income taxes . . 0.02 0.01 0.01 (0.01)
Net income attributable to Tyco common shareholders ........ $ 0.64 $ 0.65 $ 0.52 $ 0.54
Diluted earnings per share attributable to Tyco common
shareholders:
Income from continuing operations ...................... $ 0.62 $ 0.64 $ 0.50 $ 0.55
Income (loss) from discontinued operations, net of income taxes . . 0.01 0.01 0.01 (0.02)
Net income attributable to Tyco common shareholders ........ $ 0.63 $ 0.65 $ 0.51 $ 0.53
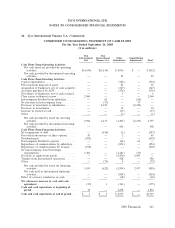
2009
1st Qtr. 2nd Qtr.(1) 3rd Qtr. 4th Qtr.
Revenue ......................................... $4,340 $ 4,068 $4,152 $4,322
Gross Profit ...................................... 1,539 1,417 1,475 1,581
Income (loss) from continuing operations attributable to Tyco
common shareholders .............................. 271 (2,561) 244 201
Income (loss) from discontinued operations, net of income taxes 6 (6) 43 4
Net income (loss) attributable to Tyco common shareholders . . . 277 (2,567) 287 205
Basic earnings per share attributable to Tyco common
shareholders:
Income (loss) from continuing operations ............... $ 0.57 $ (5.41) $ 0.52 $ 0.42
Income (loss) from discontinued operations, net of income taxes 0.02 (0.01) 0.09 0.01
Net income (loss) attributable to Tyco common shareholders . $ 0.59 $ (5.42) $ 0.61 $ 0.43
Diluted earnings per share attributable to Tyco common
shareholders:
Income (loss) from continuing operations ............... $ 0.57 $ (5.41) $ 0.51 $ 0.42
Income (loss) from discontinued operations, net of income taxes 0.01 (0.01) 0.09 0.01
Net income (loss) attributable to Tyco common shareholders . $ 0.58 $ (5.42) $ 0.60 $ 0.43
(1) Loss from continuing operations includes goodwill and intangible asset impairments of $2.7 billion.
2010 Financials 153