ADT 2010 Annual Report Download - page 55
Download and view the complete annual report
Please find page 55 of the 2010 ADT annual report below. You can navigate through the pages in the report by either clicking on the pages listed below, or by using the keyword search tool below to find specific information within the annual report.-
 1
1 -
2
-
3
-
4
-
5
-
6
-
7
-
8
-
9
-
10
-
11
-
12
-
13
-
14
-
15
-
16
-
17
-
18
-
19
-
20
-
21
-
22
-
23
-
24
-
25
-
26
-
27
-
28
-
29
-
30
-
31
-
32
-
33
-
34
-
35
-
36
-
37
-
38
-
39
-
40
-
41
-
42
-
43
-
44
-
 45
45 -
 46
46 -
 47
47 -
 48
48 -
 49
49 -
 50
50 -
 51
51 -
 52
52 -
 53
53 -
 54
54 -
 55
55 -
 56
56 -
 57
57 -
 58
58 -
 59
59 -
 60
60 -
 61
61 -
 62
62 -
 63
63 -
 64
64 -
 65
65 -
66
-
67
-
68
-
69
-
70
-
71
-
72
-
73
-
74
-
75
-
76
-
77
-
78
-
79
-
80
-
81
-
82
-
83
-
84
-
85
-
86
-
87
-
88
-
89
-
90
-
91
-
92
-
93
-
94
-
95
-
96
-
97
-
98
-
99
-
100
-
101
-
102
-
103
-
104
-
105
-
106
-
107
-
108
-
109
-
110
-
111
-
112
-
113
-
114
-
115
-
116
-
117
-
118
-
119
-
120
-
121
-
122
-
123
-
124
-
125
-
126
-
127
-
128
-
129
-
130
-
131
-
132
-
133
-
134
-
135
-
136
-
137
-
138
-
139
-
140
-
141
-
142
-
143
-
144
-
145
-
146
-
147
-
148
-
149
-
150
-
151
-
152
-
153
-
154
-
155
-
156
-
157
-
158
-
159
-
160
-
161
-
162
-
163
-
164
-
165
-
166
-
167
-
168
-
169
-
170
-
171
-
172
-
173
-
174
-
175
-
176
-
177
-
178
-
179
-
180
-
181
-
182
-
183
-
184
-
185
-
186
-
187
-
188
-
189
-
190
-
191
-
192
-
193
-
194
-
195
-
196
-
197
-
198
-
199
-
200
-
201
-
202
-
203
-
204
-
205
-
206
-
207
-
208
-
209
-
210
-
211
-
212
-
213
-
214
-
215
-
216
-
217
-
218
-
219
-
220
-
221
-
222
-
223
-
224
-
225
-
226
-
227
-
228
-
229
-
230
-
231
-
232
-
233
-
234
-
235
-
236
-
237
-
238
-
239
-
240
-
241
-
242
-
243
-
244
-
245
-
246
-
247
-
248
-
249
-
250
-
251
-
252
-
253
-
254
-
255
-
256
-
257
-
258
-
259
-
260
-
261
-
262
-
263
-
264
-
265
-
266
-
267
-
268
-
269
-
270
-
271
-
272
-
273
-
274
-
275
-
276
-
277
-
278
-
279
-
280
-
281
-
282
-
283
-
284
-
285
-
286
-
287
-
288
-
289
-
290
-
291
-
292
 |
 |

16DEC201011085777
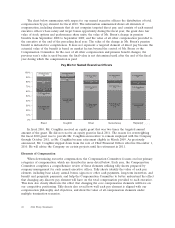
Process Overview: How the Compensation Committee Designs and Establishes Executive Compensation
The Compensation Committee evaluates many factors when designing and establishing executive
compensation plans and targets. In determining the appropriate compensation of individual named
executive officers, the Compensation Committee considers critical data including the relative complexity
and importance of the executive’s role within the organization, the executive’s experience, record of
performance and potential, the compensation levels paid to similarly positioned executives at our peer
group companies, and internal pay equity considerations.
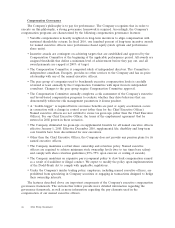
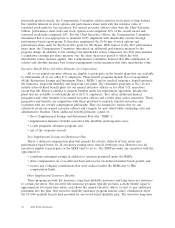
Each year, the Compensation Committee reviews the composition of the Company’s peer group
with the assistance of its independent compensation consultant to ensure that it aligns with the
Company’s size and lines of businesses. Any change to the peer group is subject to the Compensation
Committee’s approval. The peer group is drawn from companies in the S&P 500 Index, and the
Compensation Committee analyzes up to 17 factors in determining inclusion, including rank within the
S&P 500 Index, overlapping business lines, number of employees, and various performance and
financial measures. During fiscal 2010, the Compensation Committee updated the peer group to
replace four companies (FedEx, UPS, L3 Communications and Masco Corp.) with five peers that are
deemed to be more similar to the Company. The five additions are highlighted in the table below. The
change did not have any significant affect on median levels of compensation for the peer group. The
peer group now consists of 17 industrial and service companies that reflect the competitive landscape in
which Tyco operates. It also takes into account the diverse nature of the Company’s operations, which
are a blend of world-class manufacturing capabilities and premier service delivery.
Peer Group Companies
• 3M Co. • General Dynamics Corp. •
• Danaher Corp. • Honeywell International, Inc. • Sprint Nextel Corp.
Time Warner Cable Inc.
Raytheon Co.
• Deere & Co. • Illinois Tool Works, Inc. •
• DirecTV Group, Inc. • Ingersoll-Rand PLC • United Technologies Corp.
• Eaton Corp. • ITT Corp. • Waste Management, Inc.
• Emerson Electric Co. • Johnson Controls Inc.
In addition to the peer group, summary statistical information about general industry practices
(excepting those of financial service companies) is another source of executive compensation market
data for the Committee. The Company’s talent strategy calls for both the development of internal
leadership and the recruitment of highly experienced leaders from outside the Company. Tyco does not
position executive pay to reflect a single percentile within the peer group, but broadly targets the
50th percentile for base salaries and performance-based pay at or slightly above the 50th percentile.
Although these benchmarks represent useful guidelines, the Compensation Committee exercises
discretion in setting individual executive compensation packages so that they appropriately reflect the
value and expected contributions of each executive to the Company, as well as the executive’s
leadership, commitment to our values, and potential for advancement.
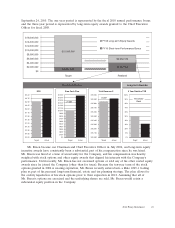
The Company believes that one of most important features of a compensation program that pays
for performance is an appropriate weighting of pay elements that align management’s interest with
those of shareholders. As a result, the Compensation Committee places the greatest proportion of
executive pay in long-term equity compensation for named executive officers, with the aim of tying the
executive’s realized pay to sustained shareholder returns. It also places a significant portion of cash
compensation in the form of performance bonuses. In fiscal 2010, approximately 71% of targeted direct
pay for our Chief Executive Officer, and approximately 74% for the rest of our named executive
officers, was in the form of long term equity awards. Additionally, over 50% of targeted cash
compensation for our Chief Executive Officer and the rest of our named executive officers was in the
form of an annual performance bonus.
2011 Proxy Statement 47